[Preprint]. 2025 Jul 7:2025.07.03.663002.
doi: 10.1101/2025.07.03.663002.

PRMT5 activity sustains histone production to maintain genome integrity

Affiliations

PRMT5 activity sustains histone production to maintain genome integrity

Jacob S Roth et al. bioRxiv. .

Abstract

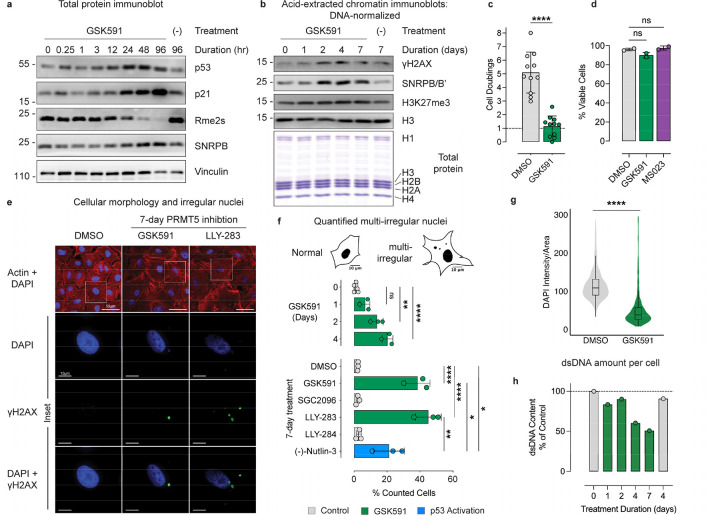
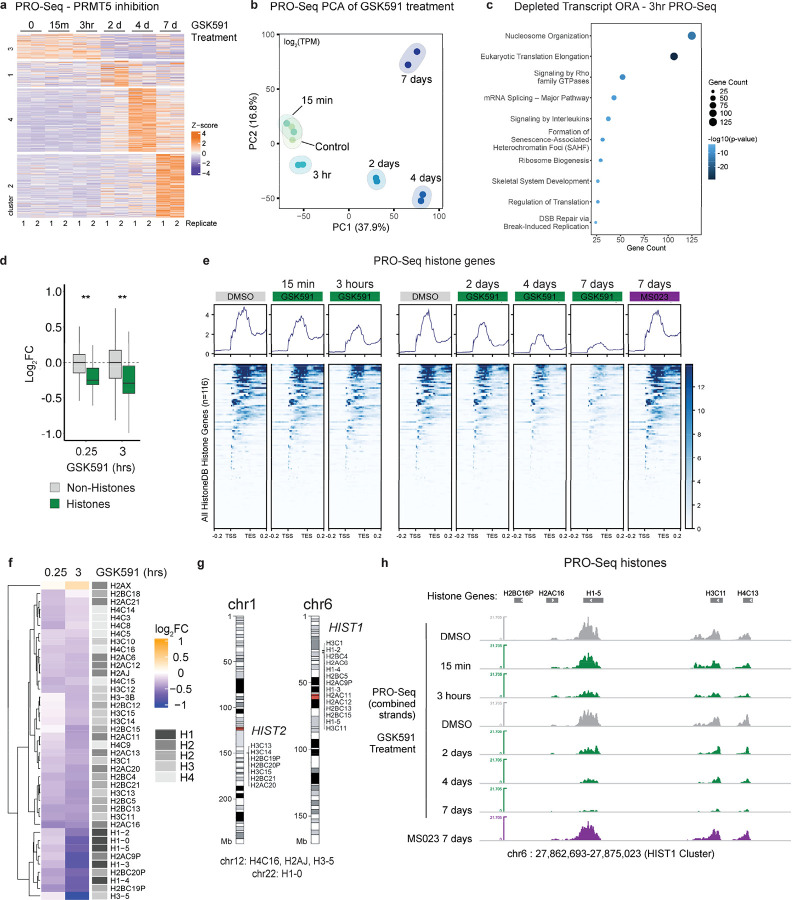
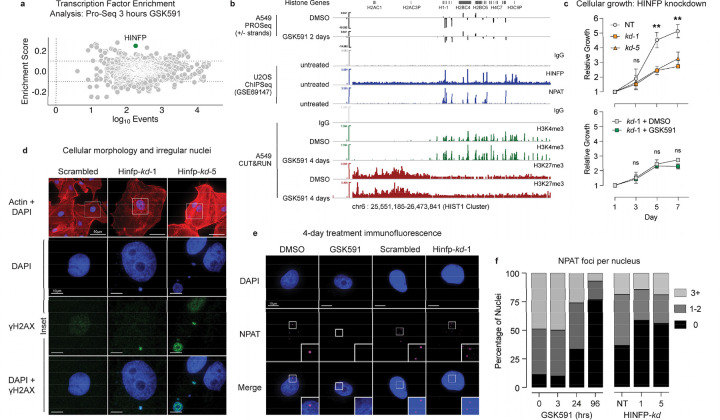
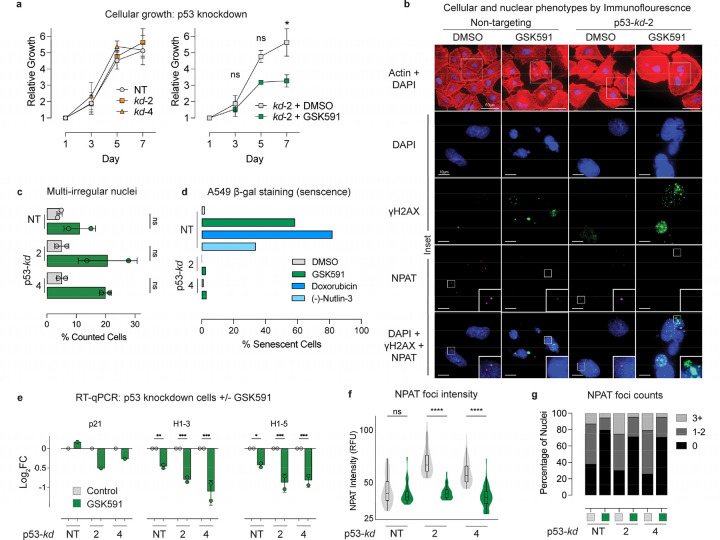
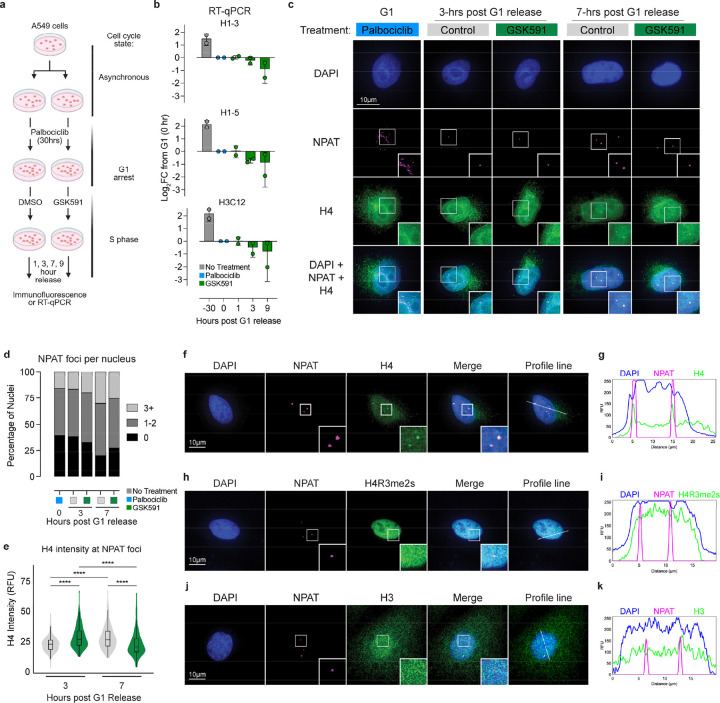
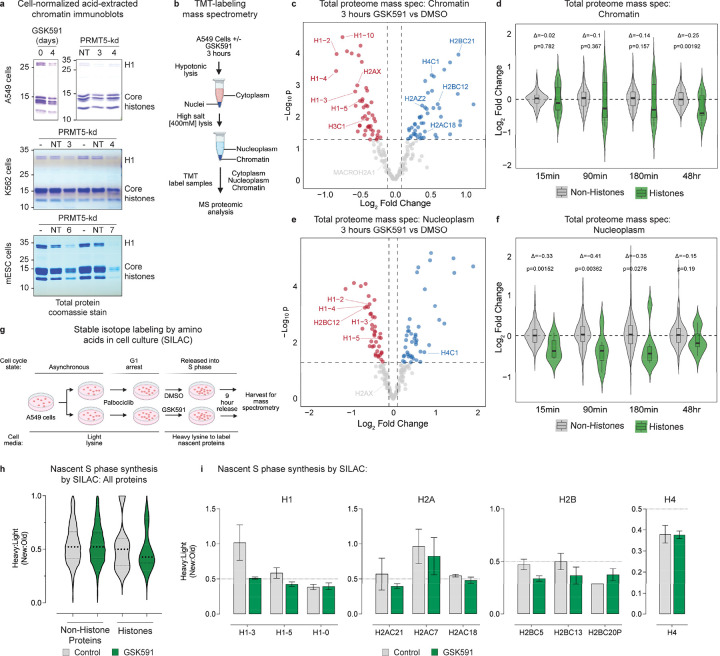
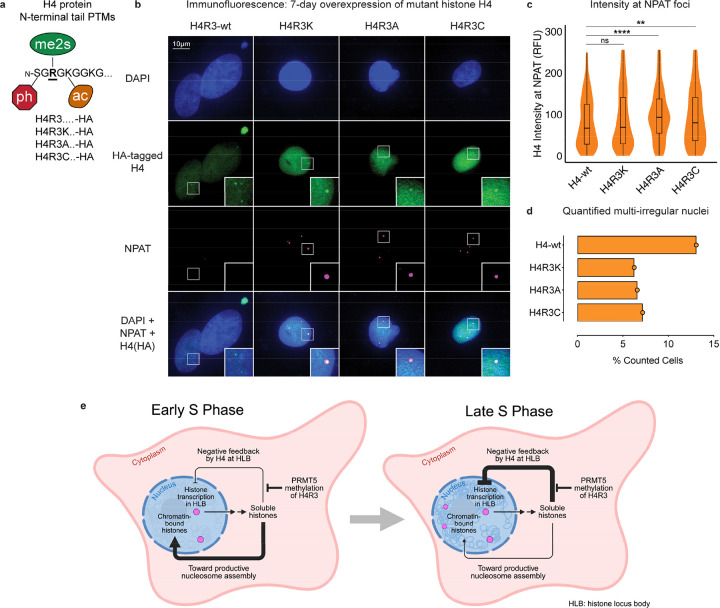
Histone proteins package DNA into nucleosomes, forming chromatin and thereby safeguarding genome integrity. Proper histone expression is essential for cell proliferation and chromatin organization, yet the upstream regulators of histone supply remain incompletely understood. PRMT5-a cell essential type II protein arginine methyltransferase frequently overexpressed in cancer-catalyzes symmetric dimethylation of arginine residues. Using time-resolved nascent transcriptional profiling, quantitative proteomics, and imaging, we show that PRMT5 activity is required to sustain histone transcription and histone protein synthesis during S phase. PRMT5 inhibition or knockdown leads to rapid histone mRNA depletion, loss of histone proteins, and accumulation of replication-associated nuclear abnormalities. We further show that soluble histone H4 accumulates at histone locus bodies (HLBs) upon PRMT5 inhibition, and that PRMT5-substrate H4 Arginine 3 mutants localize more robustly to HLBs than do wildtype H4. These findings support a model in which PRMT5-mediated methylation of histone H4 regulates histone transcription. Our findings establish PRMT5 as a central coordinator of histone homeostasis and provide a mechanistic rationale for its essential role in proliferating cells.

Keywords: Arginine Methylation; Genome Integrity; H1; H4R3C; H4R3me2s; Histone H4; Histone Transcription; Methyltransferase; PRMT5; Post-Translational Modifications; methylarginine; micronuclei; oncohistone; symmetric dimethylation.


Conflict of interest statement

Conflict of Interest The authors declare that they have no conflicts of interest with the contents of this article. The content is solely the responsibility of the authors and does not necessarily represent the official views of the National Institutes of Health. J.B. was an employee of Arpeggio Bio, and J.A. is an employee and founder of Arpeggio Bio, which was contracted to undertake the PRO-seq experiments described in this paper.

Figures

Figure 1.
Figure 1.. PRMT5 disruption induces γH2AX containing micronuclei.
a) Immunoblots of total cellular lysate after PRMT5 inhibition. b) Immunoblots of acid-extracted chromatin after PRMT5 inhibition, loading normalized by DNA content. c) Cell count of A549 cells after 4-day PRMT5 inhibition. d) Trypan blue viability of A549 cells after 4-day PRMT5 inhibition. e) A549 cells treated with 7-days of PRMT5 inhibition, highlighting enlarged “fried-egg” appearance of DAPI-stained nuclei (blue) in actin (red). Immunofluorescence staining of γH2AX (green) overlaid upon nuclei (blue), highlighting γH2AX-positive micronuclei separate from the primary nucleus. Scale bar 50μm in Actin+DAPI and 10μm in inset images. f) Quantified multi-irregular nuclei observed after treating A549 cells with 0 to 4 days of PRMT5 inhibition and 7 days of PRMT5 inhibition, PRMT5-inhibitor negative controls, or p53 activation by (-)-Nutlin3a. Inset images of representative “Normal” (7-day DMSO) and “Multi-irregular” (7-day GSK591) nuclei; DAPI thresholding in FIJI to highlight nuclei with actin outline. g) Ratio of DAPI intensity per nucleus area (RFU/μm2) from 7-day PRMT5-inhibited cells; >100 cells were analyzed for each of three biological replicates in each treatment. h) TRIzol-extracted and quantified dsDNA from equivalent cell number; n=1 biological replicate. Student’s one-tailed t-test was applied; p-value = *<0.05, **<0.005, ***<0.0005, ****<0.00005, n.s. = not significant.
Figure 2.
Figure 2.. Nascent transcriptomics identifies PRMT5 activity is required for histone transcription.
a) Heatmap comparing changes in nascent transcription over the duration of PRMT5 inhibition. Color corresponds to Z-score corrected transcripts per million (TPM). b) PCA analysis of PRO-seq data. c) Over enrichment analysis of transcripts reduced in transcription after 3-hours of PRMT5 inhibition. Enrichment completed with Metascape. d) Random permutation testing of Log2FC nascent transcription response for all histone genes vs all other genes at 15 minutes and 3-hours of PRMT5 inhibition (100,000 permutations). p-value = **<0.005. e) Metaplot of average PRO-seq signal across all histone gene bodies −0.2 kilobases preceding the transcription start site and +0.2 kilobases following the transcription end site (TES). Histone genes retrieved from HistoneDB; plots made with deep-Tools. f) Heatmap plotting the log2FC of all histone genes observed at 15 min and 3-hours of PRMT5 inhibition via PRO-seq. g) Schematic of the replication-dependent histone genes with reduced transcription at 3-hours after PRMT5-inhibition, highlighting the histone clusters HIST1 and HIST2 on chromosomes 6 and 1, respectively. Plots made with KaryoploteR. h) Read density (combined PRO-seq strands) at representative histone genes within the HIST1 cluster on chromosome 6.
Figure 3.
Figure 3.. PRMT5 inhibition phenocopies histone transcription arrest caused by HINFP knockdown.
a) Transcription factor enrichment analysis (TFEA) of PRO-seq data at 3 hours of PRMT5 inhibition by GSK591. b) IGV overview plot at the HIST1 locus on chromosome 6: 2-day GSK591 PRO-seq data, U2OS cell ChIP-Seq data for HINFP and NPAT binding (GSE69147), A549 cell H3K4me3 and H3K27me3 CUT&RUN data. c) Growth curves measuring metabolic activity of A549 cells after HINFP knockdown ± PRMT5 inhibition; mean ±SD, n=2 biological replicates. Student’s one-tailed t-test; p-value = **<0.005, n.s. = not significant. d) A549 cells after 7-days HINFP knockdown, highlighting enlarged “fried-egg” appearance of DAPI-stained nuclei (blue) in actin (red). Immunofluorescence staining of γH2AX (green) overlaid upon nuclei (blue), highlighting γH2AX-positive micronuclei separate from the primary nucleus. Scale bar 50μm in Actin+DAPI and 10μm in inset images. e) IF of NPAT in 4-day PRMT5 inhibited and 4-day HINFP knockdown A549 cells. f) Count of NPAT foci per nucleus following 0-, 3-, 24-, or 96-hours of PRMT5 inhibition or HINFP knockdown for 4-days; n=1 biological replicate with >200 nuclei counted/condition for GSK591 time course; n=2 biological replicates with >75 nuclei counted/condition for HINFP knockdown.
Figure 4.
Figure 4.. PRMT5 activity is required for histone transcription irrespective of p53 status.
a) Growth curve measuring metabolic activity of A549 cells after p53 knockdown, ± PRMT5 inhibition; mean ±SD, n=2 biological replicates. b) Rhodamine–phalloidin (red) and DAPI (blue) stained p53 knockdown A549 cells treated with 4-days PRMT5 inhibition. Immunofluorescence staining of γH2AX (green) overlaid upon DAPI-stained nuclei; NPAT (magenta) labeling histone locus bodies. c) Quantified multi-irregular nuclei from p53 knockdown A549 cells ±PRMT5 inhibition; n=2 biological replicates, >125 cells counted/replicate. d) β-galactosidase staining positivity of p53 knockdown cells ±PRMT5 inhibition in A549 cells. e) RT-qPCR analysis of p53 knockdown A549 cells treated with 24-hours GSK591. f-g) NPAT foci intensity and count ±p53 knockdown ±PRMT5 inhibition quantified from immunofluorescence slides; n=2 biological replicates, >125 cells counted/replicate. Student’s one-tailed t-tests were applied; p-value = *<0.05, **<0.005, ***<0.0005, ****<0.00005, n.s. = not significant.
Figure 5.
Figure 5.. PRMT5 activity maintains histone transcription in S phase.
a) Schematic of palbociclib G1 arrest with release into S phase. b) RT-qPCR of representative histone transcripts throughout S phase ± PRMT5 inhibition. c) IF throughout S phase ± PRMT5 inhibition of NPAT visualizing NPAT foci (histone locus bodies; magenta) and histone H4 (green) overlaid upon DAPI-stained nuclei (blue). d-e) NPAT foci count and intensity throughout S phase ± PRMT5 inhibition; n=1 biological replicate, >100 cells/condition. Student’s one-tailed t-tests was applied; p-value = ****<0.00005, n.s. = not significant. f-g) IF of NPAT (magenta), H4 (green), and DAPI-stained nuclei (blue) and profile line plot of intensities, highlighting overlap of NPAT and H4. h-i) IF of NPAT (magenta), H4Rme2s (green), and DAPI-stained nuclei (blue) and profile line plot of intensities, highlighting lack of overlap between NPAT and H4Rme2s. j-k) IF of NPAT (magenta), H3 (green), and DAPI-stained nuclei (blue) and profile line plot of intensities, highlighting lack of overlap between NPAT and H3.
Figure 6.
Figure 6.. PRMT5 activity is required for histone protein production during S phase.
a) Immunoblots of acid-extracted chromatin from equal cell number; top: 4 days of PRMT5-inhibition or 7 days of PRMT5 knockdown in A549 cells, middle: 5 days of PRMT5 knockdown in K562 cells, bottom: 4 days of PRMT5 knockdown in mESCs (un-transfected negative control (-) and non-targeting negative control (NT)). b) TMT-labeling mass spectrometry experimental set-up. c) Total proteome mass spectrometry on the chromatin fraction. d) Non-histone vs histone Log2FC over time; chromatin fraction. Random permutation test (10,000). e) Total proteome mass spectrometry on the nucleoplasmic fraction. f) Non-histone vs histone Log2FC over time; nucleoplasmic fraction. Random permutation test (10,000). g) Experimental set-up for G1 phase-release SILAC mass spectrometry. h) Nascent S phase synthesis by SILAC; histones vs non-histones. i) Nascent S phase synthesis for selected histones. Bars represent mean ±SEM of 4 replicates.
Figure 7.
Figure 7.. Histone H4 negatively regulates feedback on histone transcription to induce micronuclei.
a) Representative H4 N-terminal tail highlighting H4S1phosphorylation, H4R3 symmetric dimethylation, and H4K5acetylation. b) Immunofluorescence of overexpressed HA-tagged H4 in A549 cells. c) Intensity of HA-H4 at NPAT foci; n=1 biological replicate, >225 cells/condition. d) Count of multi-irregular nuclei per cell; n=1 biological replicate, >225 cells/condition. e) A unifying hypothesis on histone transcription regulation by PRMT5: PRMT5 methylates nascent histone H4 in S phase to prevent premature H4 accumulation at histone locus bodies, delaying transcriptional feedback to support histone production. Created in BioRender.

Similar articles

References

    1. Rubin J.D. et al. Transcription factor enrichment analysis (TFEA) quantifies the activity of multiple transcription factors from a single experiment. Communications Biology 4 (2021). 10.1038/s42003-021-02153-7 - DOI - PMC - PubMed
    1. Zhou Y. et al. Metascape provides a biologist-oriented resource for the analysis of systems-level datasets. Nature Communications 10 (2019). 10.1038/s41467-019-09234-6 - DOI - PMC - PubMed
    1. Sokolova M. et al. Genome-wide screen of cell-cycle regulators in normal and tumor cells identifies a differential response to nucleosome depletion. Cell Cycle 16, 189–199 (2017). 10.1080/15384101.2016.1261765 - DOI - PMC - PubMed
    1. Gel B. & Serra E. karyoploteR: an R/Bioconductor package to plot customizable genomes displaying arbitrary data. Bioinformatics 33, 3088–3090 (2017). 10.1093/bioinformatics/btx346 - DOI - PMC - PubMed
    1. Luger K., Mäder A.W., Richmond R.K., Sargent D.F. & Richmond T.J. Crystal structure of the nucleosome core particle at 2.8 Å resolution. Nature 389, 251–260 (1997). 10.1038/38444 - DOI - PubMed

Publication types

LinkOut - more resources