[Preprint]. 2025 Jul 10:2024.07.04.602005.
doi: 10.1101/2024.07.04.602005.

Time-resolved functional connectivity during visuomotor graph learning

Affiliations

Time-resolved functional connectivity during visuomotor graph learning

Sophie Loman et al. bioRxiv. .

Abstract

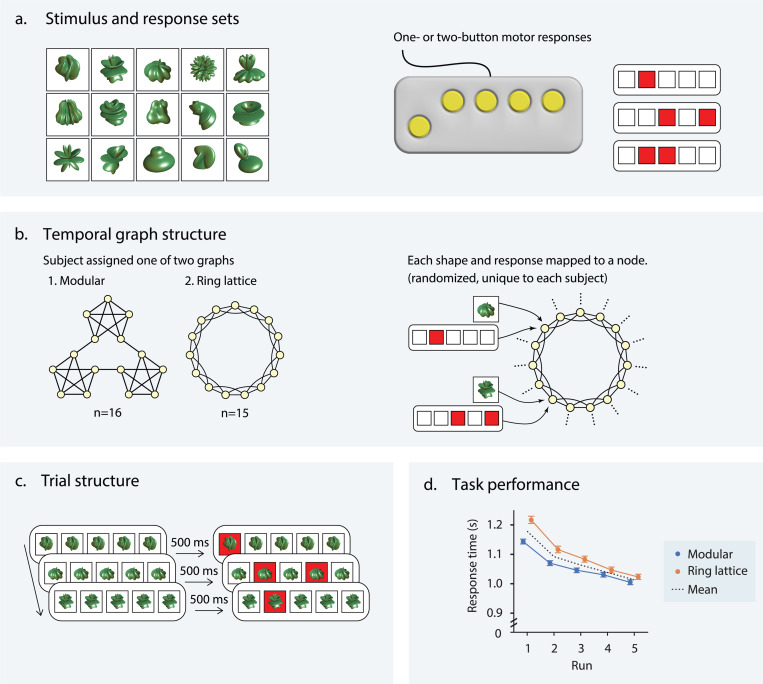
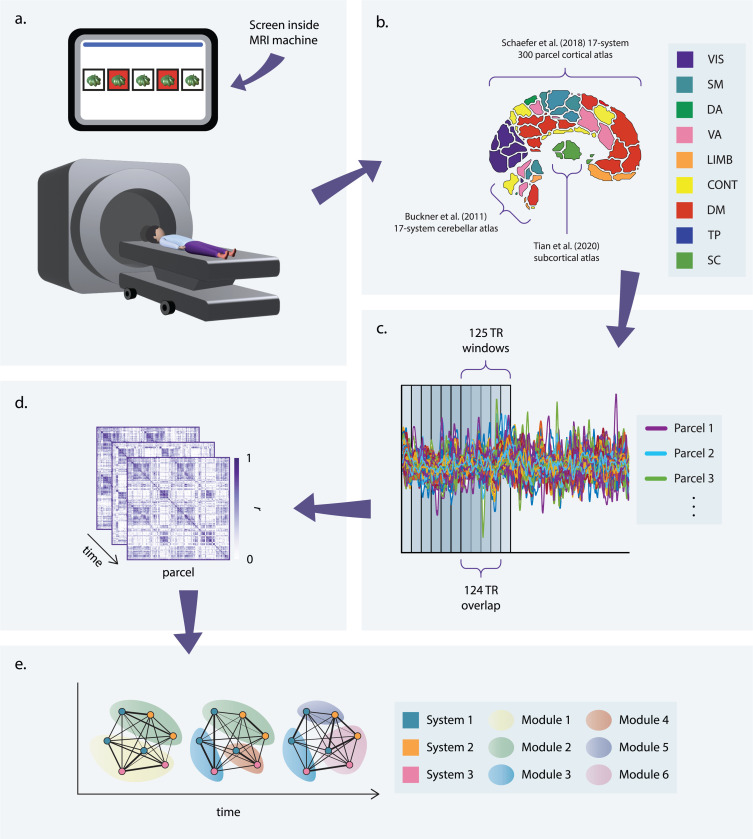
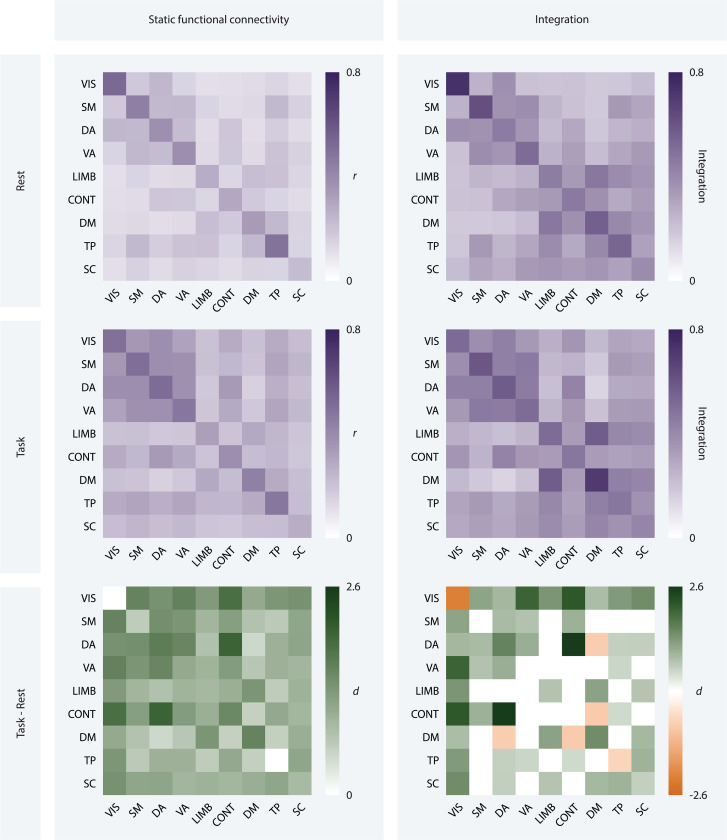
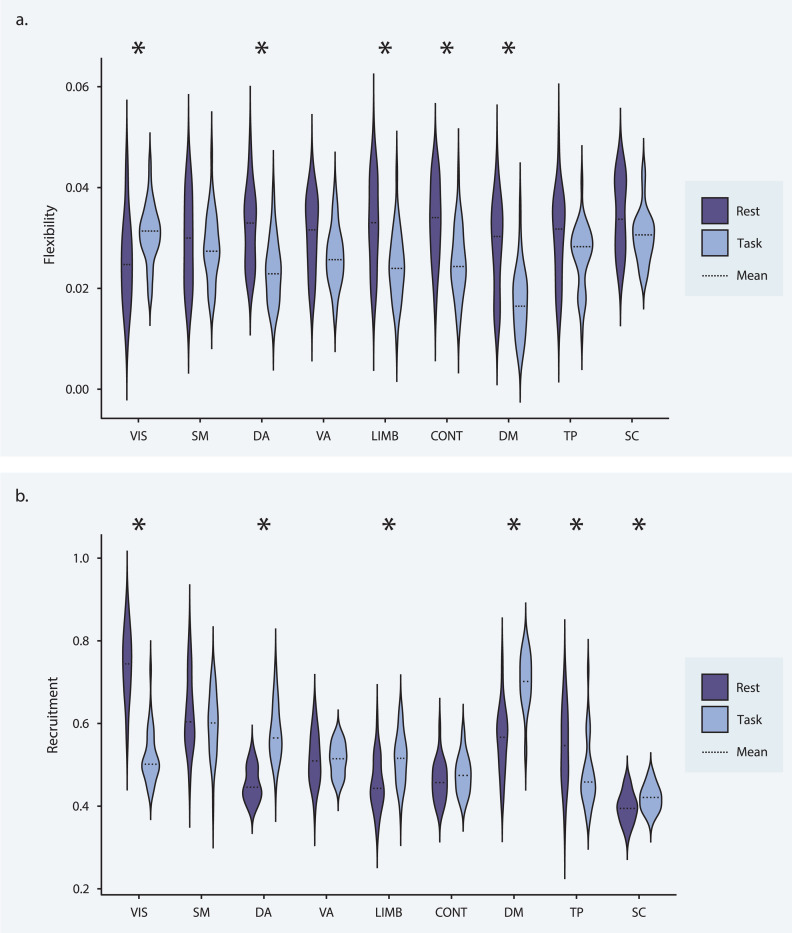
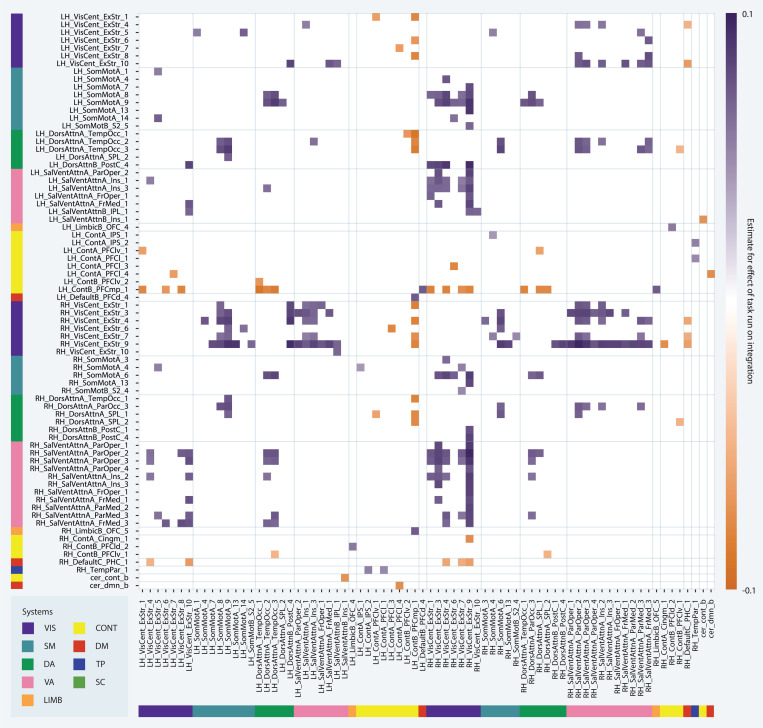
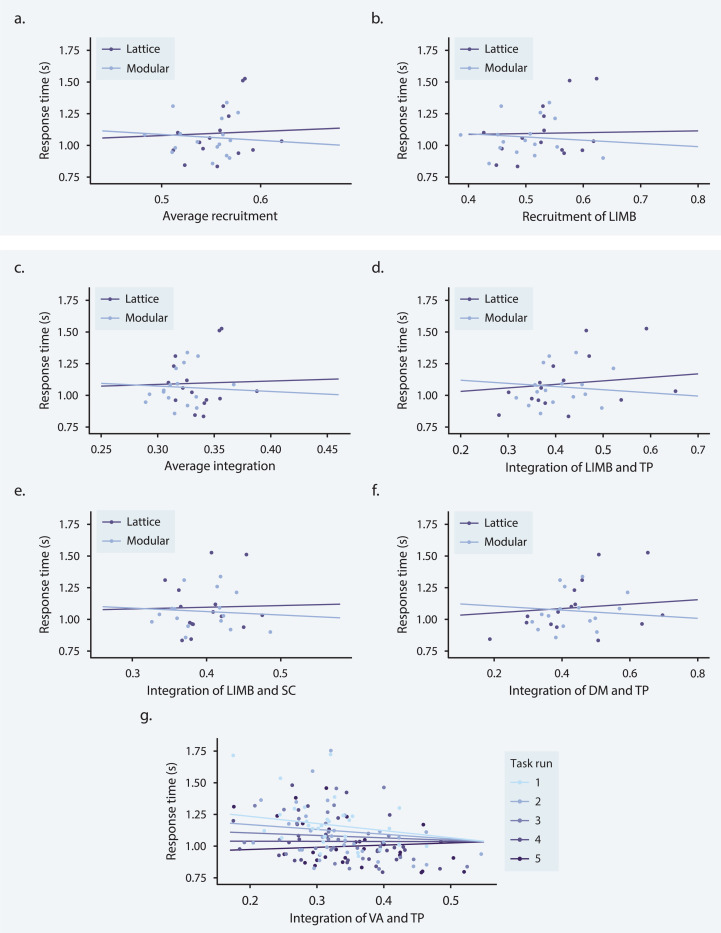
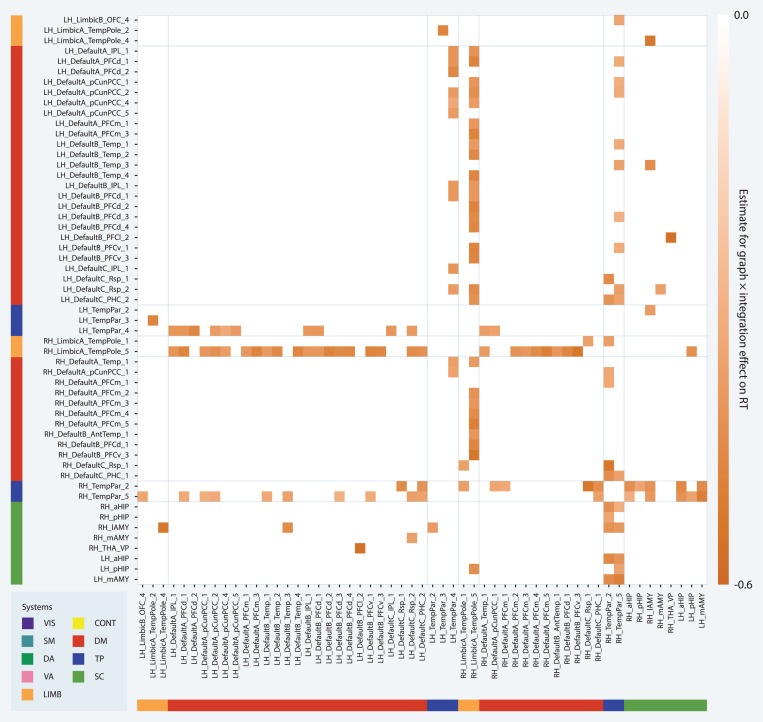
Humans naturally attend to patterns that emerge in our perceptual environments, building mental models that allow future experiences to be processed more effectively and efficiently. Perceptual events and statistical relations can be represented as nodes and edges in a graph. Recent work in graph learning has shown that human behavior is sensitive to graph topology, but little is known about how that topology might elicit distinct neural responses during learning. Here, we address this knowledge gap by applying time-resolved network analyses to fMRI data collected during a visuomotor graph learning task. We assess neural signatures of learning on two types of structures: modular and non-modular lattice graphs. We find that task performance is supported by a highly flexible visual system, relatively stable brain-wide community structure, cohesiveness within the dorsal attention, limbic, default mode, and subcortical systems, and an increasing degree of integration between the visual and ventral attention systems. Additionally, we find that the time-resolved connectivity of the limbic, default mode, temporoparietal, and subcortical systems is associated with enhanced performance on modular graphs but not on lattice-like graphs. These findings provide evidence for the differential processing of statistical patterns with distinct underlying graph topologies. Our work highlights the similarities between the neural correlates of graph learning and those of statistical learning.


Figures

Figure 1:
Figure 1:. Visuomotor graph learning task.
(a) During the visuomotor learning task, study participants were trained on a set of 15 abstract shapes (left) and 15 possible one- or two-button combinations on a controller (right). (b) Each participant was assigned to one of two conditions: stimuli organized on a modular graph and stimuli organized on a ring lattice graph (left). The 15 shapes and motor responses were mapped to one of the 15 nodes in the assigned graph (right). To control for differences among shapes and motor responses, each mapping was random and unique to a participant. (c) Participants were visually instructed as to which buttons to press (i.e., those indicated by the red squares). To encourage participants to learn the shape-motor response mappings, the shape appeared 500 milliseconds before the motor command. (d) Response time (seconds) as a function of task run for correct trials; color indicates whether participants were trained on the lattice graph (orange) or the modular graph (blue); colored markers indicate participant averages for each run; error bars indicate 95% confidence intervals; black line indicates mean across both graph groups. Adapted with permission from [46].
Figure 2:
Figure 2:. Study design.
(a) Participants completed the visuomotor graph learning task while in an MRI scanner. (b) To parse whole-brain fMRI data into regions of interest, we applied 3 parcellation schemes: a 17-system, 300-parcel cortical atlas [54]; a 17-parcel cerebellar atlas, provided with an allocation scheme of each parcel to one of the 17 cortical systems [55]; and a 32-parcel subcortical atlas [56]. Averaging over subsystems of the 17-system atlases (e.g., over visual systems A and B) and across all subcortical parcels yielded a coarse-grained 9-system parcellation. (c) Time series were extracted for each parcel. To obtain time-resolved measures of network structure, these time series were divided into overlapping windows. (d) Functional connectivity matrices were obtained for each window by computing the product-moment correlation coefficient, r), for each pair of time series in a given window. (e) The functional connectivity matrices from panel (d) encode edge weights for a series of fully connected networks for each scan. Community detection was performed on each network to identify modules corresponding to groups of strongly connected nodes.
Figure 3:
Figure 3:. Static and time-resolved metrics of functional organization during rest and task.
Static functional connectivity (left) and integration (right) matrices for resting-state (top) and task fMRI data (middle), averaged across participants, task runs, and systems. Each entry on the x- and y-axes corresponds to a system. The darker the square, the stronger the connection between the corresponding systems (left), or the more frequently they are assigned to the same module (right). Effect size matrices (bottom) show the magnitude and direction of the effect of condition on static functional connectivity and integration using Cohen’s d. The darker the purple or orange, the larger the magnitude of the effect. Purple squares indicate an increase in value from rest to task, while orange squares indicate a decrease in value from rest to task, and white squares indicate no difference surviving a statistical threshold of pFDR < 0.05.
Figure 4:
Figure 4:. Recruitment and flexibility during rest and task.
(a) Average recruitment by system for rest (purple) and task (blue) data. The dashed line indicates the mean. Asterisks indicate differences surviving a statistical threshold of pFDR < 0.05. (b) Average flexibility by system for rest (purple) and task (blue) data. The dashed line indicates the mean. Asterisks indicate differences that survive a statistical threshold of pFDR < 0.05.
Figure 5:
Figure 5:. Network changes over task run.
Main effect of task run on integration values at the parcel level. Each entry on the x- and y-axes corresponds to a parcel. Each square of the matrix indicates the estimate for the effect of run according to the corresponding multilevel model.
Figure 6:
Figure 6:. System level network predictors of response time.
(a–f) Interaction effect of graph × network metric on response time for three network metrics. Each data point represents a participant; purple and blue lines indicate best fits for participants trained on lattice (purple) and modular (blue) graphs. (a) Interaction effect of graph × average recruitment on response time. (b) Interaction effect of graph × limbic recruitment on response time. (c) Interaction effect of graph × average integration on response time. (d) Interaction effect of graph × limbic and temporoparietal integration on response time. (e) Interaction effect of graph × limbic and subcortical integration on response time. (f) Interaction effect of graph × default mode and temporoparietal integration on response time. (g) Interaction effect of run × ventral attention and temporoparietal integration on response time. Each data point represents a participant; graded purple and blue lines indicate best fit for each task run.
Figure 7:
Figure 7:. Parcel level network predictors of response time.
(a–f) Interaction effect of graph × integration on response time for parcel level integration values. Each entry on the x- and y-axes corresponds to a parcel. Each square of the matrix indicates the estimate for the effect of graph × integration according to the corresponding multilevel model. The darker the square, the more negative the relationship between response time and integration for the modular group as compared to the lattice group.

Similar articles

References

    1. Vitevitch Michael S. and Luce Paul A.. “Probabilistic Phonotactics and Neighborhood Activation in Spoken Word Recognition”. In: Journal of Memory and Language 40.3 (Apr. 1999), pp. 374–408. ISSN: 0749596X. DOI: 10.1006/jmla.1998.2618. URL: https://linkinghub.elsevier.com/retrieve/pii/S0749596X98926183. - DOI
    1. Gopnik Alison and Wellman Henry M.. “Reconstructing constructivism: Causal models, Bayesian learning mechanisms, and the theory theory”. In: Psychological Bulletin 138.6 (2012), pp. 1085–1108. ISSN: 00332909. DOI: 10.1037/a0028044. - DOI - PMC - PubMed
    1. Schapiro Anna C. and Turk-Browne Nicholas B.. “Statistical Learning”. In: Brain Mapping. Vol. 3. Elsevier, 2015, pp. 501–506. ISBN: 9780123970251. DOI: 10.1016/B978-0-12-397025-1.00276-1. URL: https://linkinghub.elsevier.com/retrieve/pii/B9780123970251002761. - DOI
    1. Fiser József and Aslin Richard N.. “Statistical learning of higher-order temporal structure from visual shape sequences.” In: Journal of Experimental Psychology: Learning, Memory, and Cognition 28.3 (2002), pp. 458–467. ISSN: 1939–1285. DOI: 10.1037/0278-7393.28.3.458. URL: http://doi.apa.org/getdoi.cfm?doi=10.1037/0278-7393.28.3.458. - DOI - PubMed
    1. Brady Timothy F. and Oliva Aude. “Statistical Learning Using Real-World Scenes”. In: Psychological Science 19.7 (2008), pp. 678–685. ISSN: 0956–7976. DOI: 10.1111/j.1467-9280.2008.02142.x. - DOI - PMC - PubMed

Publication types

LinkOut - more resources