[Preprint]. 2025 Jul 10:2025.07.06.663368.
doi: 10.1101/2025.07.06.663368.

HER2; p53 Co-mutated Cancers Show Increased Histone Acetylation and are Sensitive to Neratinib plus Trastuzumab Deruxtecan

Affiliations

HER2; p53 Co-mutated Cancers Show Increased Histone Acetylation and are Sensitive to Neratinib plus Trastuzumab Deruxtecan

Xiaoqing Cheng et al. bioRxiv. .

Abstract

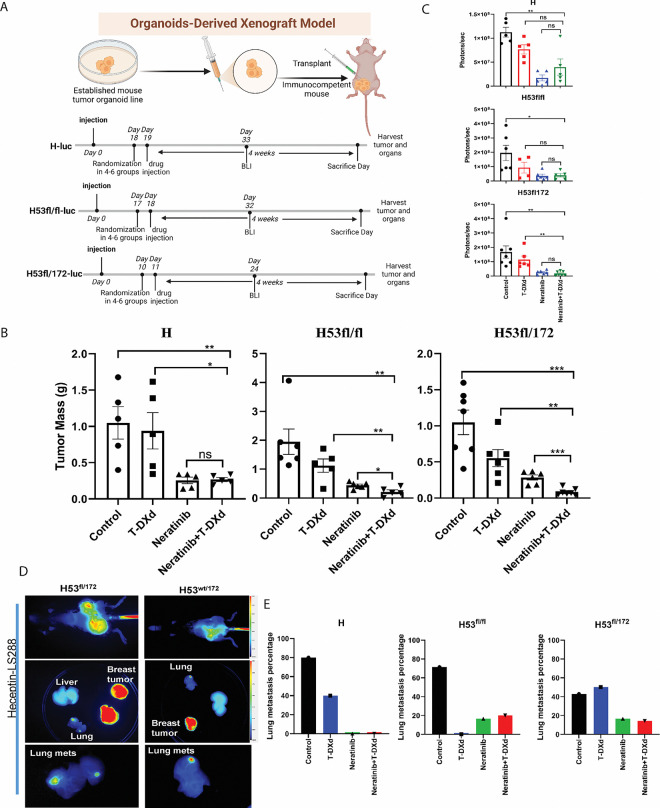
In metastatic breast cancer, HER2-activating mutations often co-occur with TP53 mutations, a combination linked to poor response to neratinib and worse prognosis. To model this clinical challenge, we bred HER2 V777L transgenic mice with two TP53 mutant alleles: TP53 R172H (the murine homolog of human TP53 R175H) and TP53 fl/fl, which mimics p53 truncations common in human tumors. TP53 mutations accelerated tumor development and reduced survival in HER2-mutant mice. These co-mutant tumors were resistant to neratinib but remained sensitive to exatecan, the topoisomerase I (TOP1) inhibitor payload in trastuzumab deruxtecan (T-DXd). Mechanistically, TP53 mutant tumors exhibited upregulation of histone acetylation, hypertranscription of DNA repair factors, increased chromatin accessibility, and rendered cells more susceptible to TOP1 inhibitors via G2/M arrest and apoptosis. This vulnerability is dependent on transcriptional activity of TP53 mutations, highlighting a novel strategy to treat HER2;TP53 co-mutant breast cancers using TOP1-targeted therapies.

Keywords: Breast cancer; histone modification; neratinib; p53 mutant; trastuzumab deruxtecan.


Conflict of interest statement

Conflict of Interest Disclosures: R. Bose received a research grant from Puma Biotechnology, Inc. and has performed consulting on a HER2 clinical trial for Genentech. Neratinib used in this study was provided by Puma Biotechnology, Inc.

Figures

Fig. 1:
Fig. 1:. Characterization of H53 tumors in mice with HER2V777L and P53fl/fl or P53R172H.
(A) Key to the genotype of the murine breast cancer models. (B) Representative hematoxylin and eosin (H&E) staining of image of tumor slides from H, H53wt/fl, H53wt/172, H53fl/fl, H53fl/172 mice. Scale bars of low-power images are 5 mm. Scale bars of high-power images are 500 μm. (C) Immunohistochemistry (IHC) staining of HER2, ERα, SMA of mammary gland tumor tissue sections from H53wt/fl, H53fl/fl, and H53fl/172 mice, respectively. Scale bars of low-power images are 5 mm. Scale bars of high-power images are 100 μm. (D) Kaplan-Meier analysis shows overall survival (right) and tumor-free (left) of H, and H53 null mice, respectively. (E) Kaplan-Meier analysis shows overall survival (right) and tumor-free (left) of H, H53wt/fl, H53wt/172, and H53fl/172 mice, respectively.
Fig. 2:
Fig. 2:. Organoids derived from H53 tumors show resistance to neratinib, but are more sensitive in vitro to TOP1 inhibitors.
(A) Representative morphology of tumor organoids derived from mammary gland tumors from the H, Hwt/fl, Hwt/172, H53fl/fl, and H53fl/172 mice. (B) Immunohistochemistry (IHC) staining of HER2, ERα, and SMA images of tumor organoids from H and H53fl/fl mice, respectively. Scale bars of low-power images are 5 mm. Scale bars of high-power images are 100 μm. (C) Representative IC50 assay of neratinib on organoids derived from mammary gland tumors from the H, Hwt/172, H53fl/fl, and H53fl/172 mice. (D) Representative IC50 assay of exatecan on organoids derived from mammary gland tumors from the H, Hwt/172, H53fl/fl, and H53fl/172 mice. (E) The cell cycle profile was assayed by FACS analysis with PI staining on the breast tumor organoids isolated from H, HP, and H53fl/fl mice without or with trastuzumab, exatecan, and TDXd treatment. (F) Uptake assay in T-D474 cell lines was performed using an Incucyte S3 Live Cell Analysis System (Sartorius).
Fig. 3:
Fig. 3:. TOP1 inhibitor induce replication-associated DNA damage
(A) Testing the combined effect of T-DXd and neratinib in H53fl/fl, H53wt/172, and H53fl/172 organoid cell lines. Drug synergy, as per the Lowe model, is indicated by blue colors on the 3D surface, whereas green colors indicate additivity. (B) Cell cycle arrest assay using Flow cytometry assay with Brdu and Propidium iodide co-staining after 12 hours of treatment of exatecan at 100nM and 1uM on organoids derived from H and H53fl/fl mice. (C) The percentage of cells in each cell cycle phase was detected by Brdu-PI co-staining from tumor organoid cells isolated from H, HP, and H53fl/fl mice. Error bars represent the standard deviation (SD) of triplicate technical replicates. (D) Western blotting p53, p21, phospho-CHK1, phospho-H2Ax, phospho-caspase3, and GAPDH from indicated mice breast-derived organoids after 2 days of exatecan treatment at 100nM. (E) Quantification of the percentage of apoptotic organoid cells. Apoptosis assay using FACS by annexin V staining after 3and 4 days treatment of 100nM exatecan on organoids derived from H, HP and H53fl/fl group mice. Error bars represent the standard deviation (SD) of triplicate technical replicates. (F) Immunofluorescence staining of γH2AX, EdU, and DAPI in 3D-grown organoids, as indicated. Error bar is 25μm.
Fig. 4:
Fig. 4:. Drug testing in vivo on mice with T-DXd and Neratinib, which is a genetic determinant of drug sensitivity.
(A) Schematic view of the drug treatment timelines in each transplanted model as indicated. Mice were treated with saline water, Neratinib only, T-DXd, and Neratinib plus T-DXd, respectively, for 4 weeks. Neratinib was given daily at 40mg/kg by oral gavage. T-DXd was given weekly at 30mg/kg by tail vein injection for two doses. (B) Tumor mass after treatment in transplanted models with different genotyped organoid cells. (C) Representative BLI graph with measurements of treated mice after harvesting. (D) Imaging of near-infrared fluorophore-labeled trastuzumab (NIR-trastuzumab) at 24 hours post-injection on the whole body of H53wt/172, H53fl/172 mice. (E) The percentage of lung metastasis in organoid transplanted mice of H, H53fl/fl, and H53fl/172. Data in (B) and (C) are plotted as mean ± SEM. *P < .05, **P < .01, ***P < .001, and ****P < .0001 as calculated by the Unpaired t-test.
Fig. 5:
Fig. 5:. The genetic determinant of drug sensitivity is p53 transcription activity dependent.
(A) Cell cycle assay using flow cytometry with Propidium iodide (PI) staining after treatment of exatecan at 100nM at indicated timepoint on organoids derived from H (Top) and H53fl/fl (bottom) mice. (B) Western blotting of KAP1, p21, phosphor-KAP1, phospho-CHK1, total CHK1, phospho-CHK2, total CHK2, phospho-HER2, total HER2, phospho-H2Ax, phospho-caspase3 and GAPDH from exatecan-treated H53 null organoid cells in Figure 3A. (C) The cell cycle profile was assayed by FACS analysis with PI staining on the breast tumor organoids isolated from H53wt/fl, H53fl/fl, and H53fl/172 mice. (D) The percentage of cells in each cell cycle phases was detected by BrdU-PI co-staining from tumor organoids cells isolated from Hwt/172, H53fl/fl, and H53fl/172 mice. Error bars are based on triplicated technical replicates. (E) Cell cycle phase analysis based on the FACS result from figure 5D. Error bars are based on triplicate of technical repeats. (F) Quantification of the percentage of apoptotic organoid cells. Apoptosis assay using FACS by annexin V staining after 3 days of treatment of 100nM exatecan on organoids derived from H, HP, and H53fl/fl group mice. Error bars are based on triplicate of technical repeats.
Fig. 6:
Fig. 6:. Histone modification proteomics using organoids derived from H and H53wt/fl, H53wt/172, H53 fl/fl, and H53 fl/172 mice tumors
(A) PCA analysis confirms transgene-based lineage relationship and genetic heterogeneity in histone samples. (B) Heatmap showing the top 25 histone modifications of DEGs (abs(log2 FC) > 1, Padj < 0.05) between H, H53 co-mutated organoid samples. (C) Venn diagram shows the shared histone modification marks among H53 co-mutated organoid samples compared with H-only groups. (D) The histone modification identified peaks in the mass spectrometry system. (E) Western blotting results detecting the H3K9ac, H3, TOP1, p-HER2, HER2, KAP1, GAPDH, γ H2Ax, p53, and p73 level in H, H53 co-mutated organoid samples. (F) The model shows histone acetylation in chromatin remodeling by neutralizing the histone charge.
Fig. 7:
Fig. 7:. H3K9AC marks the promoters of P53 and TOP1 in all breast cancer types. Human PDX HCI003 shows mild synergy when combined with neratinib and T-DXd.
(A-B) H3K9AC marks the promoters of p53, p73, ATM, KAP1, TOP1, TOP2A, TOP2B, and NPAT, but not p63 in all breast cancer types. H3K9me3 doesn’t mark the p53, p73, p63, ATM, KAP1, TOP1, TOP2A, TOP2B, and NPAT promoters in all breast cancer types. (C)The PDX tumor microarray of triple negative breast cancer showed increased H3K9AC IHC signal. (D)Tumor staining Allred score and H score of H3K9AC IHC signal from tumor microarray in Fig 7C. (E)The information of PDXO is in the TNBC PDX list. (F-G) Synergy of neratinib and T-DXd in human PDX of WHIM2, WHIM12, and WHIM30. (H) The in vivo treatment of the WHIM2 with neratinib and T-DXd.

Similar articles

References

    1. Slamon DJ, Clark GM, Wong SG, Levin WJ, Ullrich A, McGuire WL. Human breast cancer: correlation of relapse and survival with amplification of the HER-2/neu oncogene. Science. 1987;235(4785):177–82. doi: 10.1126/science.3798106. - DOI - PubMed
    1. Gradishar WJ. HER2 therapy--an abundance of riches. N Engl J Med. 2012;366(2):176–8. Epub 20111207. doi: 10.1056/NEJMe1113641. - DOI - PubMed
    1. Bose R, Kavuri SM, Searleman AC, Shen W, Shen D, Koboldt DC, Monsey J, Goel N, Aronson AB, Li S, Ma CX, Ding L, Mardis ER, Ellis MJ. Activating HER2 mutations in HER2 gene amplification negative breast cancer. Cancer Discov. 2013;3(2):224–37. Epub 20121207. doi: 10.1158/2159-8290.CD-12-0349. - DOI - PMC - PubMed
    1. Cheng X, Sun Y, Highkin M, Vemalapally N, Jin X, Zhou B, Prior JL, Tipton AR, Li S, Iliuk A, Achilefu S, Hagemann IS, Edwards JR, Bose R. Breast Cancer Mutations HER2V777L and PIK3CAH1047R Activate the p21-CDK4/6-Cyclin D1 Axis to Drive Tumorigenesis and Drug Resistance. Cancer Res. 2023;83(17):2839–57. doi: 10.1158/0008-5472.Can-22-3558. - DOI - PMC - PubMed
    1. Cheng X. A Comprehensive Review of HER2 in Cancer Biology and Therapeutics. Genes. 2024;15(7):903. - PMC - PubMed

Publication types