[Preprint]. 2025 Jul 10:2025.07.07.663558.
doi: 10.1101/2025.07.07.663558.

Single-nucleotide Resolution Epitranscriptomic Profiling Uncovers Dynamic m6A Regulation in Bovine Preimplantation Development

Affiliations

Single-nucleotide Resolution Epitranscriptomic Profiling Uncovers Dynamic m6A Regulation in Bovine Preimplantation Development

Rajan Iyyappan et al. bioRxiv. .

Abstract

RNA N 6-methyladenosine (m6A) plays a crucial role in regulating gene expression during early embryonic development. However, the m6A dynamics at single-nucleotide resolution in preimplantation development remain uncharacterized, and the functional significance of site specific m6A modifications in key developmental regulators is largely unknown. Here, using SAC-seq, a single-base resolution, antibody-independent m6A profiling method, we generate the first comprehensive m6A landscape in bovine oocytes and preimplantation embryos. We identify a previously uncharacterized m6A site in RPL12 transcript that is essential for embryonic development. Loss of m6A at this site leads to reduced protein synthesis, disrupted expression of translation-related genes, and impaired zygotic genome activation and blastocyst formation. Notably, supplementation with wild-type RPL12 mRNA fails to rescue the developmental arrest, indicating that m6A regulation extends beyond transcript abundance. Our findings provide a valuable resource of m6A at single-nucleotide resolution in mammalian embryogenesis and uncover a critical mechanism by which precise, site-specific m6A regulates translation and developmental competence in early embryos.


Conflict of interest statement

Competing interests The authors declare no competing interests. P.K.J. is a co-founder of CasNx, LLC and CRISPR, LLC.

Figures

Figure 1.
Figure 1.. Transcriptome-wide mapping of m6A in bovine oocytes and preimplantation embryos by SAC-seq.
A. Schematic overview of m6A-SAC-seq profiling across bovine oocytes and preimplantation embryo stages, from germinal vesicle (GV) oocyte to blastocyst (BL). Principal component analysis (PCA) of transcriptome (left) and m A epitranscriptome (right) reveals stage-specific clustering patterns across development. B. Sequence logos representing nucleotide enrichment around m6A sites in different developmental stages. C-D. Density plots showing the positional distribution of m6A sites within transcripts, separated by developmental stages and motif type DRACH (C) and Non-DRACH (D) motifs. Dashed lines indicate stop codon. Black bars below each plot represent transcript regions (5′UTR, CDS, 3′UTR). E. Bar graph showing the number of m6A sites detected per stage (red bars) and the fraction of m6A sites within canonical DRACH motifs (blue line). F. Number of m6A-modified genes per developmental stage. G. Sankey diagram showing the transition of transcripts with or without m6A modifications (m6A⁺ in red, m6A⁻ in gray) across developmental stages.
Figure 2.
Figure 2.. m6A epitranscriptomic regulation during bovine preimplantation development.
A. Bar plots showing enrichment of m6A-modified transcripts among differentially expressed genes and within protein-coding and non-coding DEGs. B. Heatmap of Z-score–normalized expression of all DEGs clustered into six groups (1–6) based on temporal expression profiles across oocyte and embryo stages. C. Fraction of genes within each expression cluster (1–6) carrying m6A marks, separated into total m A, DRACH motif–associated, and non-DRACH motif–associated m6A sites. D. Gene Ontology (GO) enrichment analysis of DEGs across expression clusters. DEGs with and without m A marking are compared within each cluster. E. Top: Heatmaps of Z-score normalized m6A levels across developmental stages (GV to BL) for five subclusters within each main cluster (1–6). Middle: Boxplots showing m6A sites per Kb for each subcluster. Bottom: Bar plots showing the proportion of m6A sites located within canonical DRACH motifs for each subcluster across Clusters 1–6.
Figure 3.
Figure 3.. Stage-specific m6A regulation of non-coding RNAs and ribosomal protein transcripts in bovine oocytes and early embryos.
A. The composition of differentially expressed non-coding RNAs. B. The number of m6A+ (red) and m6A-(gray) genes across ncRNA classes, separated by all m A sites, DRACH motif–associated, and non-DRACH motif–associated. C. Sequence logos showing enriched m6A motifs in lncRNA, snRNA, and snoRNA classes. D–F. Heatmaps showing transcriptome expression (left) and m6A dynamics (right) across developmental stages lncRNAs (D) snRNAs (E), and snoRNAs (F). G. Ribosomal protein genes showing transcriptome expression (left), m6A dynamics (middle), and translatome data (right) across embryo stages. Cluster 2 genes are subdivided into Sub1 and Sub2 clusters based on dynamics of m A modification. H. Mitochondrial ribosomal protein genes showing transcriptome expression (left), m6A dynamics (middle), and translatome data (right) across embryo stages. Genes are subdivided into four clusters based on expression trends. I. The fraction of m6A sites in DRACH motifs for Sub1 and Sub2 ribosomal protein clusters. J. Sequence logos showing enriched m6A motifs in Sub1 and Sub2 ribosomal protein clusters. K. The fraction of m6A sites in DRACH motifs for cluster 1–4 mitochondrial ribosomal protein. L. Sequence logos showing m6A motif enrichment for cluster 1–4 clusters of mitochondrial ribosomal protein.
Figure 4.
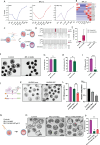
Figure 4.. Site-specific m6A modification of RPL12 is required for ZGA and blastocyst formation.
A. Trends of RPL12 transcript expression (left), m6A modification level (middle), and ribosome occupancy (Ribo-seq) (right) across developmental stages. B. The stage and site – specific m6A modification of RPL12 transcripts. C. Schematic of editing strategy: PEMax fusion is delivered into zygotes to edit the m6A site on RPL12 (148th A to G). D. Representative amplicon sequencing confirms efficient m6A site editing in RPL12 at 148th position A>G. E. Box plots showing the percentage of total reads containing precise and imprecise edits at the RPL12 A146G site in control versus edited embryos. F. Representative brightfield images showing developmental differences between control and edited embryos. G, H and I. Quantitative data showing the 2-cell, 8-cell, and blastocyst rate of control and RPL12-edited embryos. J. Schematic of demethylating strategy: dCas13–ALKBH5 fusion is delivered into zygotes to demethylate the m6A site on RPL12. K. Representative brightfield images showing developmental differences between control (ALKBH5-mut) and edited (ALKBH5-WT) embryos. L. Quantitative data showing the blastocyst rate of control and RPL12-edited embryos. M. Bar graph showing reduced enrichment of m6A at the targeted site in RPL12 following ALKBH5-based demethylation compared to control embryos, as measured by RT-qPCR. N. Schematic showing rescue strategy: zygotes were injected with wild-type RPL12 mRNA alongside editing reagents to restore normal RPL12 expression in edited embryos. O. Representative brightfield images show the blastocyst morphology in the rescue group compared to base-edited embryos. P. Quantification of blastocyst development rate shows partial or no rescue in RPL12 WT-injected embryos relative to un-rescued edited embryos.
Figure 5.
Figure 5.. Loss of m A on RPL12 impairs protein synthesis in early embryos.
A. Schematic and experimental design for total protein synthesis assay using Click-iT HMG incorporating in 8-cell stage embryos following RPL12 editing. B. Representative immunofluorescence images showing HMG incorporation (red) and nuclear staining (blue) in control and RPL12 A148G edited groups. Cycloheximide treated embryos were used as a negative control. C. Quantification of HMG signal intensity shows reduced global translation in RPL12-A148G edited embryos. D. Representative immunofluorescence images showing HMG incorporation (red) and nuclear staining (blue) in control and RPL12 demethylated groups. E. Quantification of HMG signal intensity shows reduced global translation in RPL12-demethylated embryos.
Figure 6.
Figure 6.. m6A-RPL12 regulates post-transcriptional stability and translation of ribosomal transcripts.
A. Schematic representation of the experimental design: control and RPL12 A148G–edited bovine embryos were collected at the 4-cell and 8-cell stages for total RNA-seq. B. PCA of transcriptomes from control and edited embryos at both stages. C. Differentially expressed total transcripts (refer Supplementary figure 2A–B) in 4-cell and 8-cell. D-E. Volcano plots comparing ribosomal protein genes (D) and translation initiation/elongation factors (E) between control and RPL12 A148G–edited embryos at the 4-cell stage. F-G. Volcano plots comparing ribosomal protein genes (F) and translation initiation/elongation factors (G) between control and RPL12 A148G–edited embryos at the 8-cell stage. H-I. Venn diagrams showing stage-specific overlap of differentially expressed genes in control and RPL12-edited embryos across the 4-cell and 8-cell stages. J-K. GO enrichment analysis for differentially expressed genes in control vs edited embryos at the 4-cell (J) and 8-cell (K) stages.

Similar articles

References

    1. Lee M.T., Bonneau A.R. & Giraldez A.J. Zygotic genome activation during the maternal-to-zygotic transition. Annu Rev Cell Dev Biol 30, 581–613 (2014). - PMC - PubMed
    1. Jukam D., Shariati S.A.M. & Skotheim J.M. Zygotic Genome Activation in Vertebrates. Dev Cell 42, 316–332 (2017). - PMC - PubMed
    1. Zhao B.S. et al. m(6)A-dependent maternal mRNA clearance facilitates zebrafish maternal-to-zygotic transition. Nature 542, 475–478 (2017). - PMC - PubMed
    1. Zhao B.S., Roundtree I.A. & He C. Post-transcriptional gene regulation by mRNA modifications. Nat Rev Mol Cell Biol 18, 31–42 (2017). - PMC - PubMed
    1. Yao H. et al. scm(6)A-seq reveals single-cell landscapes of the dynamic m(6)A during oocyte maturation and early embryonic development. Nat Commun 14, 315 (2023). - PMC - PubMed

Publication types

LinkOut - more resources