[Preprint]. 2025 Jul 11:2025.07.11.664281.
doi: 10.1101/2025.07.11.664281.

The mevalonate pathway of isoprenoid biosynthesis supports metabolic flexibility in Mycobacterium marinum

Affiliations

The mevalonate pathway of isoprenoid biosynthesis supports metabolic flexibility in Mycobacterium marinum

Christine M Qabar et al. bioRxiv. .

Abstract

Isoprenoids are a diverse class of natural products that are essential in all domains of life. Most bacteria synthesize isoprenoids through either the methylerythritol phosphate (MEP) pathway or the mevalonate (MEV) pathway, while a small subset encodes both pathways, including the pathogen Mycobacterium marinum (Mm). It is unclear whether the MEV pathway is functional in Mm, or why Mm encodes seemingly redundant metabolic pathways. Here we show that the MEP pathway is essential in Mm while the MEV pathway is dispensable in culture, with the ΔMEV mutant having no growth defect in axenic culture but a competitive growth defect compared to WT Mm. We found that the MEV pathway does not play a role in ex vivo or in vivo infection but does play a role in survival of peroxide stress. Metabolite profiling revealed that modulation of the MEV pathway causes compensatory changes in the concentration of MEP intermediates DOXP and CDP-ME, suggesting that the MEV pathway is functional and that the pathways interact at the metabolic level. Finally, the MEV pathway is upregulated early in the shift down to hypoxia, suggesting that it may provide metabolic flexibility to this bacterium. Interestingly, we found that our complemented strains, which vary in copy number of the polyprenyl synthetase idsB2, responded differently to peroxide and UV stresses, suggesting a role for this gene as a determinant of downstream prenyl phosphate metabolism. Together, these findings suggest that MEV may serve as an anaplerotic pathway to make isoprenoids under stress conditions.


Figures

Figure 1:
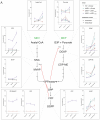
Figure 1:. Mm encodes two pathways for isoprenoid biosynthesis.
A. Two pathways of isoprenoid biosynthesis. Diagram of the MEV and MEP pathways of isoprenoid precursor biosynthesis. Enzymatic steps are indicated by italicized gene names. Important end products in mycobacteria are shown in green. B. MEV distribution in mycobacteria. The M. ulcerans-M. marinum (MuMC) clade is the only group of mycobacteria that encodes the MEV pathway. All mycobacteria, including the MuMC clade, encode the MEP pathway. Shading in green indicates species that encode MEV genes. Tree represents 84 mycobacterial species; sequences and alignment data are available in Table S1 and File S1.
Figure 2:
Figure 2:. The MEP pathway is essential in Mm.
A-B. Transcriptional repression (CRISPRi) of dxr, ispH is lethal. Guides targeting genes were cloned into the kanamycin-resistant vector pJLR965 as previously described (35, 36). (A) Upon induction of CRISPR interference machinery by addition of ATc, target genes are transcriptionally repressed. (B) Quantified CFU data from CRISPRi plates +/− ATc200. Data are compiled from 5 biological replicates. C. Plasmid loss frequency analysis of a Mm mutant in Dxr, the non-mevalonate (MEP) pathway of isoprenoid biosynthesis. MmΔdxr +pdxr, WT Mm +pdxr and WT Mm +pEmpty (empty vector) were passaged every 48hr in fresh 7H9 media without antibiotics. At each passage, cultures were serially diluted and plated on both plain and hygromycin-containing agar. Loss % < 0 indicates more CFU on hyg. N=3 biological replicates.
Figure 3:
Figure 3:. The MEV pathway is nonessential in Mm.
A. Deleting the mevalonate pathway of isoprenoid biosynthesis. The MEV locus in Mm (step 1) was replaced with a plasmid containing a hygromycin resistance marker via homologous recombination (step 2). The gene idsB2 was not deleted to avoid disruptions of isoprenoid synthesis downstream of IPP production. To generate a markerless deletion strain, the integrated plasmid was excised from the locus via induction of a phage excisionase enzyme (step 3). B. Relative expression of mevalonate (MEV) and non-mevalonate (MEP) pathway genes. Data shown are 2−ΔΔCq of ΔMEV compared to WT. Sample quantification cycle (Cq) values were normalized to respective 16s controls and ΔΔCq values were calculated for representative genes in each pathway (dxr for MEP, hmgR for MEV) in the ΔMEV strain compared to WT. N = 3. C,D. MEV deletion mutant has similar growth kinetics as WT, and complementation without idsB2 impairs growth. MmΔMEV has similar growth kinetics (C) and doubling time (D) to WT Mm, demonstrating that the MEV pathway does not support standard growth in culture. The complemented strain lacking idsB2 (ΔMEV +pMEVidsB2) has a significantly slower growth rate (D) compared to the other strains (***p=0.0001; one-way ANOVA and Dunnet’s multiple comparisons). pEmpty indicates empty vector control. Data plotted are mean ± SEM. N = 3 biological replicates.
Figure 4:
Figure 4:. Modulating either isoprenoid biosynthesis pathway impacts metabolism in the other.
A. Metabolic flux of both isoprenoid biosynthesis pathways. Shown are starting reagents and intermediates of the MEV pathway, the MEP pathway, and polyprenyl metabolism downstream of both pathways at early logarithmic, mid logarithmic, or early stationary phase (OD600 0.2, 0.5, and 2, respectively). Solid lines indicate intracellular metabolites; dotted lines indicate extracellular metabolites. N = 3 biological replicates per strain. B. MEV expression impacts relative quantities of key metabolites. ΔMEV has significantly higher levels of acetyl-CoA, DOXP, CDP-ME compared to WT, while ΔMEV +pMEV+idsB2 has significantly lower levels of these metabolites. Dotted line indicates WT levels. Strains were grown to late logarithmic phase (OD600 1) prior to analysis. Data were analyzed via one-way ANOVA followed by multiple comparisons. *p≤0.05; **p≤0.01; ***p≤0.001; ****p≤0.0001. N = 3 biological replicates per strain. C. Relative expression of dxr and hmgR in complemented strains. ΔMEV +pMEV+idsB2 had significantly elevated expression of hmgR, the rate-limiting step of the MEV pathway (open circles; p<0.0001). Both of the complemented strains had WT expression of dxr, representing the MEP pathway (closed circles; p=n.s.). Data shown are relative to 16s mRNA. N ≥ 5 per strain. Data were analyzed by using a two-way ANOVA followed by Dunnett’s multiple comparisons test. D. Adenylate energy charge (AEC) ratio to evaluate cellular energetics. AEC ratio is significantly lower in ΔMEV +pMEVidsB2 compared to all other strains, reflecting a low energy state in this strain across growth phases. N = 3 biological replicates per strain.
Figure 5:
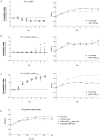
Figure 5:. ΔMEV has a competitive defect compared to WT, but ΔMEV +pMEV−idsB2 outcompetes WT.
A-C. Competitive phenotypes of all strains compared to WT. WT, ΔMEV, and complemented strains were directly competed, revealing a competitive defect in ΔMEV (A) which can be rescued by complementation with pMEV+idsB2 (B). Complementation with pMEVidsB2 resulted in strains that strongly outcompeted WT (C). Competitive index (CI) of 1 indicates strains performed comparably; CI>1 indicates mutant performed better than WT; CI<1 indicates WT performed better. pEmpty indicates empty vector control. D. Outcompetition of ΔMEV +pMEVidsB2 over WT is not due to secreted factors. There are no notable differences in WT growth between spent media from axenic or competition cultures. ‘Competition spent media’ indicates spent media isolated from WT vs ΔMEV +pMEVidsB2 competition cultures.
Figure 6:
Figure 6:. The MEV pathway does not contribute to survival during infection.
A,B. Growth and survival in macrophages is not significantly different between the strains. Wild-type BMMs were plated and grown with (A) or without (B) the activating cytokine IFNγ and subsequently infected at an MOI of 1 with various strains of Mm. For four days following infections, cells were fixed and imaged and the bacterial fluorescence and nuclei count were measured. Data plotted are the mean area of bacterial fluorescence ± SEM. N = 3 biological replicates. C,D. ΔMEV exhibits WT growth and dissemination to the brain in zebrafish. There is no significant difference in in vivo growth (C) or dissemination to the brain (D) between WT and ΔMEV strains. Larval zebrafish were infected with various strains of Mm via caudal vein injection, and fluorescent pixel count (FPC) was measured on day 2 post infection. Error bars represent mean FPC ± SEM (C; p=0.1803; N = 3 infections) or percent of disseminated bacteria (D; p=0.3471; N = 3 infections). FPC comparisons were tested with an unpaired t-test and dissemination comparisons were tested with a Fisher’s exact test.
Figure 7:
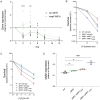
Figure 7:. MEV pathway expression has functional consequences under environmental stresses.
A. The MEV pathway is significantly upregulated early in the shift down to hypoxia. There is a significant difference in overall pathway expression between timepoints (two-way ANOVA; p=0.0006) and on days 2 and 4 of hypoxia, hmgR was significantly overexpressed compared to dxr (Sidak’s multiple comparisons; p=0.0004 and 0.0010 respectively). N=6 biological replicates. B,C. Functional consequences of modulating MEV. ΔMEV has WT resistance to UV damage (B) but is more resistant to H2O2 (C). Complemented strains are differentially sensitive to UV (B) and H2O2 stress (C). Strains were grown to mid-log, OD-matched, diluted, and exposed to UV light doses ranging from 0 to 20 mJ (B) or to H2O2 concentrations ranging from 0 to 2.5 mM (C). pEmpty indicates empty vector control. D. Relative expression of idsB2 in all strains. The knockout ΔMEV had WT levels of idsB2 expression (p=n.s.) while ΔMEV +pMEVidsB2 had slightly elevated expression (p=0.0202), potentially due to the reintroduction of regulatory elements on the plasmid. ΔMEV +pMEV+idsB2 had significantly more idsB2 expression compared to WT (p<0.0001). Data shown are relative to 16s mRNA. N = 3 per strain. Data were analyzed using one-way ANOVA followed by Tukey’s multiple comparisons.

Similar articles

  • The Black Book of Psychotropic Dosing and Monitoring.
    DeBattista C, Schatzberg AF. DeBattista C, et al. Psychopharmacol Bull. 2024 Jul 8;54(3):8-59. Psychopharmacol Bull. 2024. PMID: 38993656 Free PMC article. Review.
  • Systemic Inflammatory Response Syndrome.
    Baddam S, Burns B. Baddam S, et al. 2025 Jun 20. In: StatPearls [Internet]. Treasure Island (FL): StatPearls Publishing; 2025 Jan–. 2025 Jun 20. In: StatPearls [Internet]. Treasure Island (FL): StatPearls Publishing; 2025 Jan–. PMID: 31613449 Free Books & Documents.
  • Interventions for managing oral submucous fibrosis.
    Jones A, Veale B, Li T, Aggarwal VR, Twigg J. Jones A, et al. Cochrane Database Syst Rev. 2024 Feb 28;2(2):CD007156. doi: 10.1002/14651858.CD007156.pub3. Cochrane Database Syst Rev. 2024. PMID: 38415846 Free PMC article.
  • Orthodontic treatment for crowded teeth in children.
    Turner S, Harrison JE, Sharif FN, Owens D, Millett DT. Turner S, et al. Cochrane Database Syst Rev. 2021 Dec 31;12(12):CD003453. doi: 10.1002/14651858.CD003453.pub2. Cochrane Database Syst Rev. 2021. PMID: 34970995 Free PMC article.
  • Short-Term Memory Impairment.
    Cascella M, Al Khalili Y. Cascella M, et al. 2024 Jun 8. In: StatPearls [Internet]. Treasure Island (FL): StatPearls Publishing; 2025 Jan–. 2024 Jun 8. In: StatPearls [Internet]. Treasure Island (FL): StatPearls Publishing; 2025 Jan–. PMID: 31424720 Free Books & Documents.

References

    1. Faylo JL, Ronnebaum TA, Christianson DW. 2021. Assembly-Line Catalysis in Bifunctional Terpene Synthases. Acc Chem Res 54:3780–3791. - PMC - PubMed
    1. Sacchettini JC, Poulter CD. 1997. Creating Isoprenoid Diversity. Science 277:1788–1789. - PubMed
    1. Avalos M, Garbeva P, Vader L, van Wezel GP, Dickschat JS, Ulanova D. 2021. Biosynthesis, evolution and ecology of microbial terpenoids. Nat Prod Rep 39:249–272. - PubMed
    1. Eberl M, Hintz M, Reichenberg A, Kollas A-K, Wiesner J, Jomaa H. 2003. Microbial isoprenoid biosynthesis and human γδ T cell activation. Febs Lett 544:4–10. - PubMed
    1. Heuston S, Begley M, Gahan CGM, Hill C. 2012. Isoprenoid biosynthesis in bacterial pathogens. Microbiology+ 158:1389–1401. - PubMed

Publication types