[Preprint]. 2025 Jul 9:2025.07.09.663982.
doi: 10.1101/2025.07.09.663982.

A Bioelectrochemical Crossbar Architecture Screening Platform (BiCASP) for Extracellular Electron Transfer

Affiliations

A Bioelectrochemical Crossbar Architecture Screening Platform (BiCASP) for Extracellular Electron Transfer

Hasika Suresh et al. bioRxiv. .

Abstract

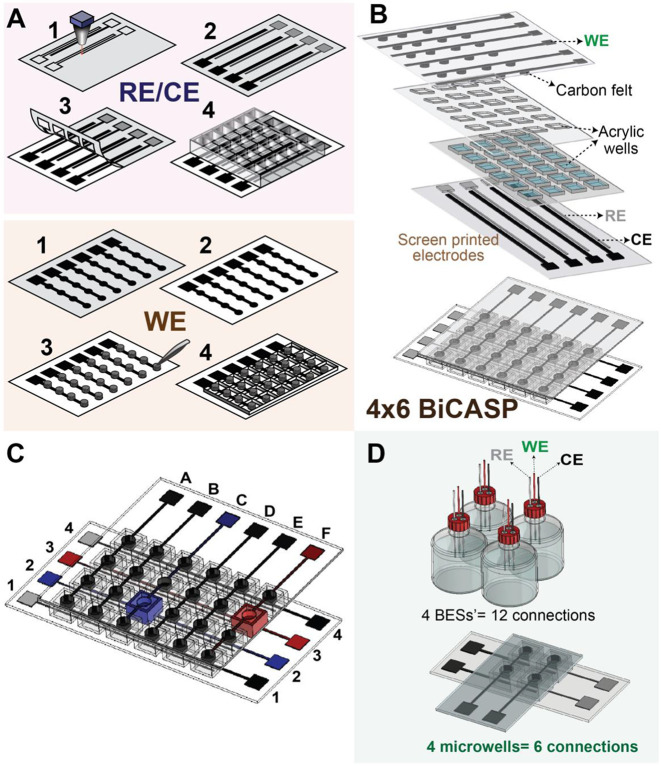
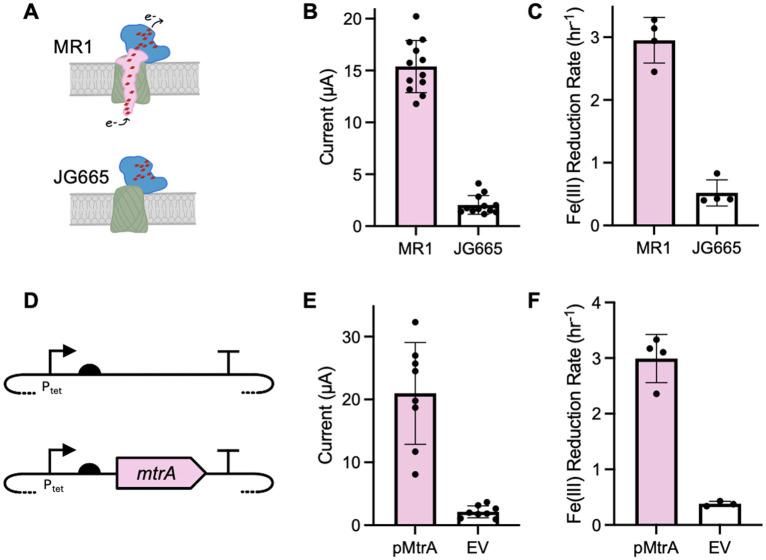
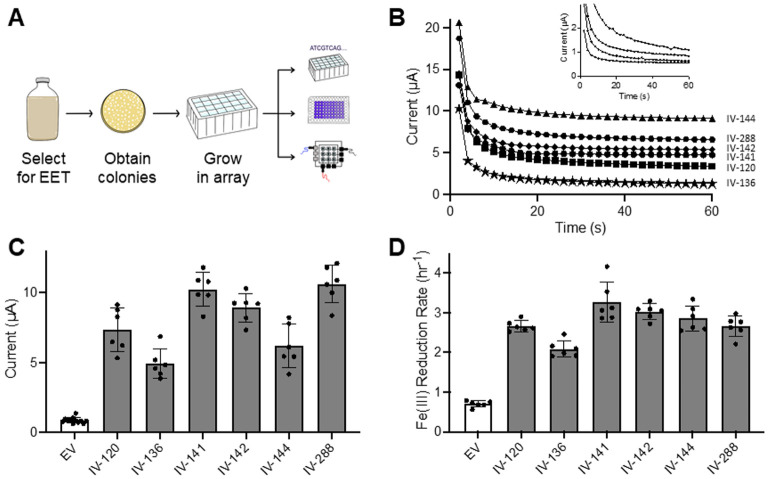
Electroactive microbes can be used as components in electrical devices to leverage their unique behavior for biotechnology, but they remain challenging to engineer because the bioelectrochemical systems (BES) used for characterization are low-throughput. To overcome this challenge, we describe the development of the Bioelectrochemical Crossbar Architecture Screening Platform (BiCASP), which allows for samples to be arrayed and characterized in individually addressable microwells. This device reliably reports on the current generated by electroactive bacteria on the minute time scale, decreasing the time for data acquisition by several orders of magnitude compared to conventional BES. Also, this device increased the throughput of screening engineered biological components in cells, quickly identifying mutants of the membrane protein wire MtrA in Shewanella oneidensis that retain the ability to support extracellular electron transfer (EET). BiCASP is expected to enable the design of new components for bioelectronics by supporting directed evolution of electroactive proteins.

Keywords: Arrayed microwells; Shewanella; bioelectrochemical systems; bioelectronics; crossbar architecture; decaheme protein; electrical multiplex; electroactive microbe; extracellular electron transfer; high-throughput screening.


Conflict of interest statement

Declaration of interests The authors declare no conflict of interest.

Figures

Figure 1.
Figure 1.. An overview showing the BiCASP architecture and connections
(A) Schematic showing the fabrication steps to make the BiCASP. For the CE/RE, Step 1: The stencil design is cut with a laser cutter, Step 2: The stencil is pasted onto a polyethylene terephthalate (PET) sheet and the electrodes are screen printed, Step 3: The stencil is peeled off exposing the RE and CE, Step 4: Acrylic well (1/4th inch) are attached to the PET sheet. For the WE, Step 1: The stencil design is cut with a laser cutter, Step 2: The stencil is pasted onto a PET sheet and the WE is screen printed, Step 3: Carbon felt is attached to the circles on the WE, Step 4: Acrylic well (1/16th inch) are attached to the PET sheet. (B) A deconstructed and an assembled version of the BiCASP in a 4x6 configuration. The RE and CE are on the bottom plane with acrylic wells housed right above each electrode pair, while the WE is used in the crossbar architecture from the top plane. (C) Image showing how individual addressability of cells can be achieved with a 4x6 BiCASP. (D) Comparison images of BiCASP in a 2x2 configuration showing the reduction in the number of connections needed for the same number of wells/cells and offering edge readout for easy handling and operation.
Figure 2.
Figure 2.. Identifying BiCASP conditions that yield strong biological signals
(A) CV curves of 0.1 M KCl and 1 mM ferro/ferricyanide showing the device’s sensitivity for redox active species. Chronoamperometry at 0.2 V vs. Ag/AgCl with MR-1 at (B) different cell concentrations (OD600 refers to the optical density (600 nm) of a 50 μL suspension of cells added to the microwell) (Linear regression analysis; R2 = 0.91 p <0.0001) (C) different lactate concentrations (Linear regression analysis; R2 = 0.66, p = 0.0014). The current increases with increasing bacterial load and lactate concentration in both cases. Bars represent the average current observed 180 seconds after beginning measurements, calculated from three biological replicates. Error bars show ±1σ.
Figure 3.
Figure 3.. BiCASP can differentiate bacteria that exhibit EET from those with EET-inactivating mutations.
(A) Two strains were compared using BiCASP, including S. oneidensis MR-1 and S. oneidensis JG665; the latter lacks mtrA and cannot support EET. (B) S. oneidensis MR-1 yields current on BiCASP that is significantly higher than that observed with S. oneidensis JG665 (Welch’s t test, p < 0.0001). (C) Visual detection of Fe(III) reduction using a ferrozine assay reveals similar differences (Welch’s t test, p = 0.0001). (D) A plasmid that constitutively expresses MtrA and an empty vector were used to evaluate complementation of S. oneidensis JG665 EET. (E) S. oneidensis JG665 transformed with the MtrA plasmid present a significantly higher current than cells harboring the empty vector (EV) (Welch’s t test, p = 0.0003). (F) Iron reduction measurements reveal similar trends (Welch’s t test, p = 0.001). For BiCASP measurements, the data represent the signal sixty seconds after beginning measurements. Data are presented as the average of eight or more biological replicates with error bars representing ±1σ.
Figure 4.
Figure 4.. BiCASP reliably identifies active MtrA mutants selected for EET.
(A) The library of MtrA mutants was grown anaerobically in medium containing ferric citrate as the only terminal electron acceptor to select for cells expressing MtrA mutants that support EET. Individual colonies were obtained by plating this culture on LB-agar medium, and these colonies were characterized using BiCASP, the Fe(III) reduction assay, and plasmid sequencing. (B) Current generated by a single replicate of cells derived from the different colonies were compared with S. oneidensis JG665 transformed with an empty vector. Each insertion variant (IV) is named based on the location of the peptide insertion. JG665 data is shown in the graph inlay. (C) BiCASP analysis of six biological replicates for each sample. Current represents the signal sixty seconds after beginning the measurement. With all insertion variants, the signal was significantly higher than in cells containing an empty vector (EV) (Welch’s t test, p ≤ 0.0004). Twelve biological replicates were analyzed for the negative control. (D) Iron reduction rates for the same samples revealed each insertion variant presents a signal that is significantly higher than the EV (Welch’s t test, p < 0.0001). Bars represent the average, while error bars show ±1σ.
Figure 5.
Figure 5.. BiCASP increases the throughput of MtrA mutant library screening.
Individual strains from a library of S. oneidensis JG665 harboring vectors that express different MtrA mutants were screened using (A) BiCASP and (B) the iron reduction assay. In total, 40 unique colonies were analyzed, but only those containing a peptide insertion are shown (n = 37). All data represent a single biological replicate, while the red line represents the average signal ±2σ obtained from cells harboring an empty vector. Four insertion mutants presenting low current from the initial screen were evaluated using larger numbers of biological replicates (n = 4) using (C) BiCASP and (D) the iron reduction assay. With BiCASP, IV-112 and IV-297 were significantly higher than the empty vector (EV) control (one tailed Welch’s t test, p < 0.05), while IV-319 had a p value of 0.051). In the iron reduction assay, the signals for all variants presenting more than 2x higher iron reduction rates were significantly higher than the empty vector (EV) control. (E) MtrA retains EET when peptides are inserted at locations spanning the outer membrane. The insertion sites of peptides (green spheres) are shown for variants whose EET activity was validated using multiple biological replicates on BiCASP.

Similar articles

References

    1. Cao Z., Xie Y., Lin J.L., Zhong S., Yan C., Yang Z., Li M., Zhou Z., Peng W., Qiu S., et al. (2024). Flexible Crossbar Molecular Devices with Patterned EGaIn Top Electrodes for Integrated All-Molecule-Circuit Implementation. Advanced Materials 36, 2406456. 10.1002/ADMA.202406456;PAGE:STRING:ARTICLE/CHAPTER. - DOI - PubMed
    1. Carnero A. (2006). High throughput screening in drug discovery. Clinical and Translational Oncology 8, 482–490. 10.1007/S12094-006-0048-2/METRICS. - DOI - PubMed
    1. Lightbody G., Haberland V., Browne F., Taggart L., Zheng H., Parkes E., and Blayney J.K. (2019). Review of applications of high-throughput sequencing in personalized medicine: Barriers and facilitators of future progress in research and clinical application. Brief Bioinform 20, 1795–1811. 10.1093/BIB/BBY051,. - DOI - PMC - PubMed
    1. Przybyla L., and Gilbert L.A. (2022). A new era in functional genomics screens. Nat Rev Genet 23, 89–103. 10.1038/S41576-021-00409-W;SUBJMETA=1647,208,2217,2490,4041,631;KWRD=CRISPR-CAS+SYSTEMS,GENETIC+INTERACTION,GENOMIC+ANALYSIS. - DOI - PubMed
    1. Punjiya M., Mocker A., Napier B., Zeeshan A., Gutsche M., and Sonkusale S. (2020). CMOS microcavity arrays for single-cell electroporation and lysis. Biosens Bioelectron 150. 10.1016/j.bios.2019.111931. - DOI - PubMed

Publication types

LinkOut - more resources