[Preprint]. 2025 Jul 11:2025.07.10.663559.
doi: 10.1101/2025.07.10.663559.

Active Dissociation of Intracortical Spiking and High Gamma Activity

Affiliations

Active Dissociation of Intracortical Spiking and High Gamma Activity

Tianhao Lei et al. bioRxiv. .

Abstract

Cortical high gamma activity (HGA) is used in many scientific investigations, yet its biophysical source is a matter of debate. Two leading hypotheses are that HGA predominantly represents summed postsynaptic potentials or-more commonly- predominantly represents summed local spikes. If the latter were true, the nearest neurons to an electrode should contribute most to HGA recorded on that electrode. We trained subjects to decouple spiking from HGA on a single electrode using a brain-machine interface. Their ability to decouple them indicated that HGA is not primarily generated by summed local spiking. Instead, HGA correlated with neuronal population co-firing of neurons that were widely distributed across millimeters. The neuronal spikes that contributed more to this co-firing also contributed more to, and preceded, spike-triggered HGA. These results suggest that HGA arises predominantly from summed postsynaptic potentials triggered by synchronous co-firing of widely distributed neurons.


Figures

Figure 1.
Figure 1.
Illustration of potential hypotheses of HGA generation. a, HGA recorded by an electrode (vertical triangle) predominantly originates from spectral leakage of summed nearby spikes through volume conduction. b, Recorded HGA predominantly reflects summed postsynaptic potentials (PSPs) that are triggered by spiking activity across the network that trigger PSPs near the recording electrode. Red traces are spike trains, at or near the axon hillock. Green traces are PSPs in dendrites and cell bodies. Purple neurites represent incoming axons from more distantly located neurons.
Figure 2.
Figure 2.
Task schematic. a, An illustration of the hand control task and the selection of control electrodes (CEs). The monkey used a manipulandum to move a cursor in a 4-target center-out reaching task. Spikes rates and cursor velocity were simultaneously recorded. The absolute value of correlation (∣R∣, see Methods) between the two signals on each electrode was calculated and used to select the CE. See Methods. b, An illustration of the 2D ONF control task. The monkey was required to control the cursor velocity with HGA and spike rate using pre-trained filters with fixed weights from the CE. The task was a 2-target center-out task.
Figure 3.
Figure 3.
Performance on the ONF task. a, Cursor traces of the last 2 s of all trials in 4 sessions from one CE of monkey C. The red square in the center of the screen is the center target. The red square at the top represents the HG target (orange traces, individual HG target trials) while the red square on the right represents the spike target (blue traces, spike target trials). Grey traces indicated failed trials (see Methods). b, Success rate for all monkey-CE combinations of each session. Each line represents one combination; note that each combination was trained for a different number of sessions. c, Mean time to target of all trials for all monkey-CE combinations of each session. d, Average path length of all trials for all monkey-CE combinations of each session. b-d: Slopes were significantly different from zero (p<0.05, one sample t-test; see Methods). e,f, Average takeoff angles and entry angles of each monkey-CE combination over sessions (see Methods). Angles did not change significantly over sessions; rather, they were generally close to 0° or 90° (for spike or HG target trials, respectively) within the first session.
Figure 4.
Figure 4.
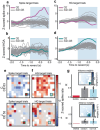
Independent modulation of spikes and HGA. a, Trial-averaged, normalized spike rate and HGA recorded on an example CE during the last 2 s of hand control when the monkey was acquiring the correct target. Shaded areas: standard error. b, Same as a, but for ONF control. Solid lines: spike target trials; Dashed lines: HG target trials; turquoise: HGA on the CE; magenta: spike rate on the CE; Shaded areas: standard error. c, Median (±IQR) correlation (R) between spike rates and HGA in hand control trials (green) and ONF control trials (red) for all monkey-CE combinations (letter-number). Each dot represents one trial. Correlations decreased significantly on all electrodes (***p<0.005, two-sided Wilcoxon rank sum test). d, Polar plot of the 2D distributions of mean (±s.d.) spike-HG angles of 20 time bins (1 s) preceding the reward time during all ONF (red) and hand control (green) from the proficient sessions over all monkey-CE combinations. Orange sector: HG+ state; blue sector: SP+ state. Gray sector: state at which both signals had high modulation.
Figure 5.
Figure 5.
Neural spiking patterns across the array during ONF. a, b, Trial-averaged, z-scored spike rates (a, magenta) and HGA on the CE (b, green) and non-CEs (gray) during the last 2 s of all the spike target trials of ONF control, aligned to reward onset. c, d same as a,b for all the HG target trials of ONF control. Data c, d same as a,b for all the HG target trials of ONF control. Data of each electrode in a-d were z-scored by the population mean and standard deviation. Shaded area highlights the neural activities during the last second of the trial. e, f Trial-averaged, z-scored spike rates over the last 1 s of spike target trials (e) and HG target trials (f) of ONF control in each array of two example monkey-CE combinations. White squares denote shunted electrodes (see Methods). CEs are outlined in green. g, Correlation coefficient (R) between CE HGA and the CE distance-weighted sum of spikes (CE DWSS, red bar), the mean (±s.d.) R between CE HGA and DWSS of 20 randomly selected electrodes (rand DWSS, grey bar; each dot is one R with one electrode), as well as the mean (±s.d.) R between HGA and DWSS pairs from 20 randomly selected electrodes excluding the CE (non-CE, light blue bar). The R value between CE HGA and CE DWSS was not significantly larger than those between CE HGA and random DWSS, or than those between non-CE and DWSS (n.s., one-sample, one-sided Mann-Whitney U test). Insets: the weights used to compute the CE DWSS. e-g, Top row: monkey C, CE 63; Bottom row: monkey J, CE 52.
Figure 6.
Figure 6.
HGA on the CE correlated more with co-firing than the CE spike rate did. a, Single trial examples comparing the first co-firing pattern (dark blue) to HGA (turquoise) and spike rate (magenta) on the CE (time relative to reward onset). b, Correlation (R) of multivariate linear regression (MLR) fit of the first co-firing pattern to spike rate (magenta), or to HGA (turquoise), averaged over all the CEs (dashed lines, individual CEs, N=9; bars, mean ± s.d., ***p=0.004, two-sided Wilcoxon signed rank test). c, R of MLR fit using an increasing number of factors to either spike rate (magenta) or HGA (magenta). We fitted a factor analysis model for each number of factors separately. Thick trace and colored shades: mean, s.d. over CEs. d, Absolute values of the co-firing weights of two example monkey-CEs. CEs outlined in red. e, Mean values of the absolute co-firing weights on the electrodes adjacent to the CE (red), as well as the mean (±s.d.) of average value of the absolute co-firing weights on the electrodes adjacent to 20 randomly selected electrodes (gray) of two example monkeys. These R values were not significantly different (p>0.4, one-sided permutation test).
Figure 7.
Figure 7.
Spikes contributing most to co-firing also contributed most to HGA. a, An illustration demonstrating the calculation of mean CE HGA triggered by non-CE spikes. For all spikes on a given electrode, we averaged the corresponding CE HGA segments from −50 to 70 ms relative to the spike times to obtain the spike-triggered HGA for that electrode. b, Spike-triggered averaged HGA of the CE (two examples shown) showed a consistent activity pattern when aligned to the spike times of other electrodes. It peaked about 12.5 ms after spike time. c, An example of spike-triggered average HGA on the CE (red square) of monkey C, CE 63, plotted on each electrode from which the spike time was used to align the HGA. Red vertical line represents the spike time; the gray dashed line represents 50 ms after the spike time. HGA traces are color-coded by the absolute values of the co-firing weights from Fig. 4d. d, K-means clustering results using 2 clusters on the STA HGA traces, color-coded by the absolute co-firing weights. Cluster with apparent peak: “With response”; without apparent peak: “No response”.) e, A comparison of the absolute co-firing weights of the two clusters (***p<0.005, two-sided Wilcoxon signed-rank test). b,d,e, Left: monkey C, CE 63; Right: monkey J, CE 52.

Similar articles

References

    1. Manning J. R., Jacobs J., Fried I. & Kahana M. J. Broadband Shifts in Local Field Potential Power Spectra Are Correlated with Single-Neuron Spiking in Humans. J. Neurosci. 29, 13613–13620 (2009). - PMC - PubMed
    1. Miller K. J., Sorensen L. B., Ojemann J. G. & Den Nijs M. Power-Law Scaling in the Brain Surface Electric Potential. PLoS Comput. Biol. 5, e1000609 (2009). - PMC - PubMed
    1. Hermes D., Miller K. J., Wandell B. A. & Winawer J. Stimulus Dependence of Gamma Oscillations in Human Visual Cortex. Cereb. Cortex 25, 2951–2959 (2015). - PMC - PubMed
    1. Nourski K. V. et al. Temporal Envelope of Time-Compressed Speech Represented in the Human Auditory Cortex. J. Neurosci. 29, 15564–15574 (2009). - PMC - PubMed
    1. Lachaux J.-P., Axmacher N., Mormann F., Halgren E. & Crone N. E. High-frequency neural activity and human cognition: Past, present and possible future of intracranial EEG research. Prog. Neurobiol. 98, 279–301 (2012). - PMC - PubMed

Publication types

LinkOut - more resources