

This is a preprint.
Using Imaris to rigorously track PET-defined sites of lung inflammation in Mycobacterium tuberculosis-exposed non-human primates
- PMID: 40672288
- PMCID: PMC12265552
- DOI: 10.1101/2025.07.04.663191
Using Imaris to rigorously track PET-defined sites of lung inflammation in Mycobacterium tuberculosis-exposed non-human primates
Abstract
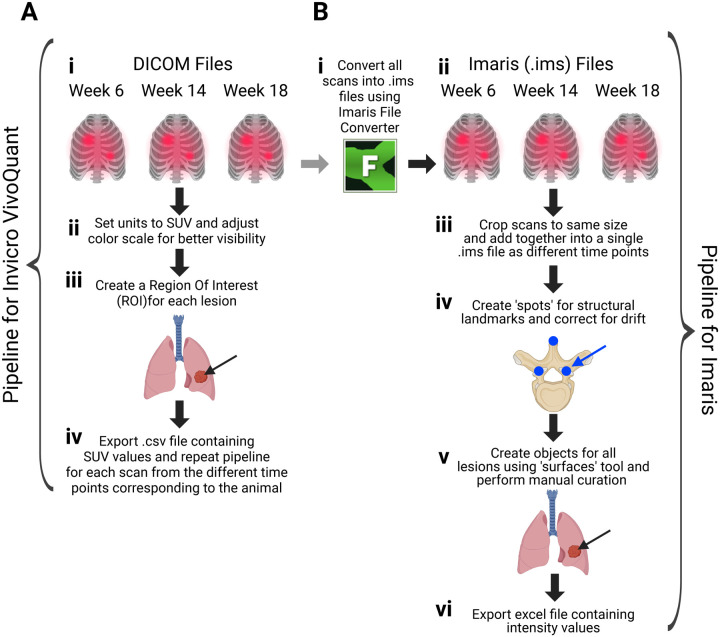
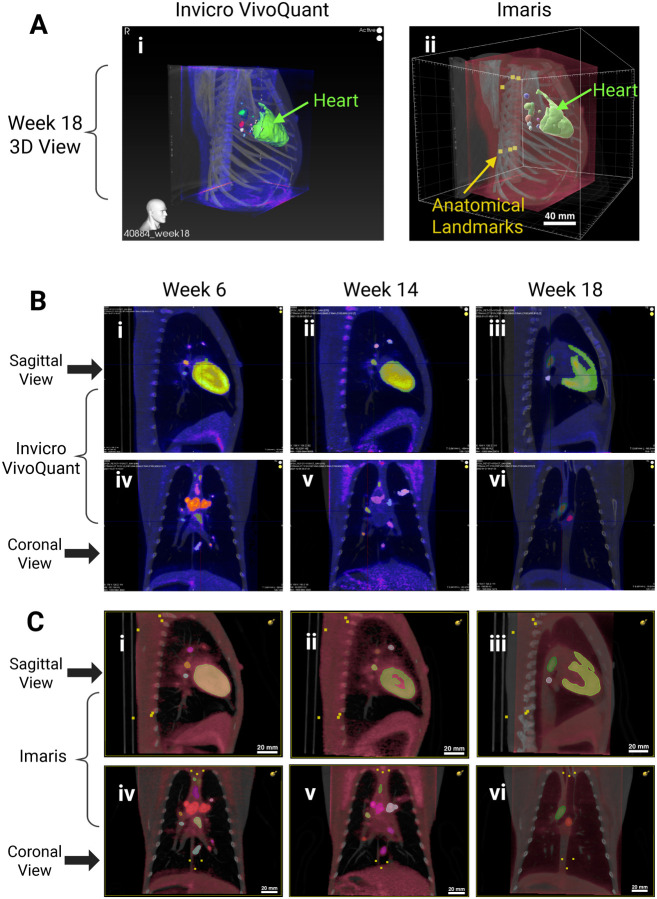
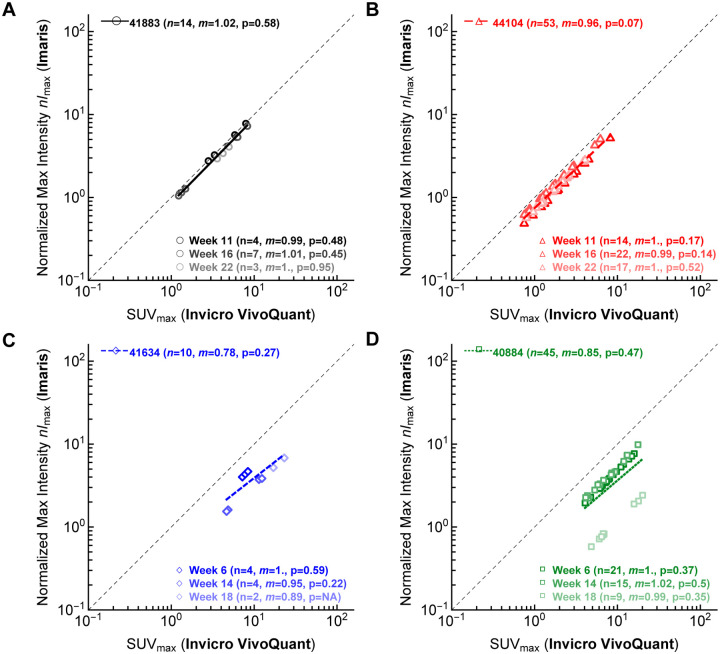
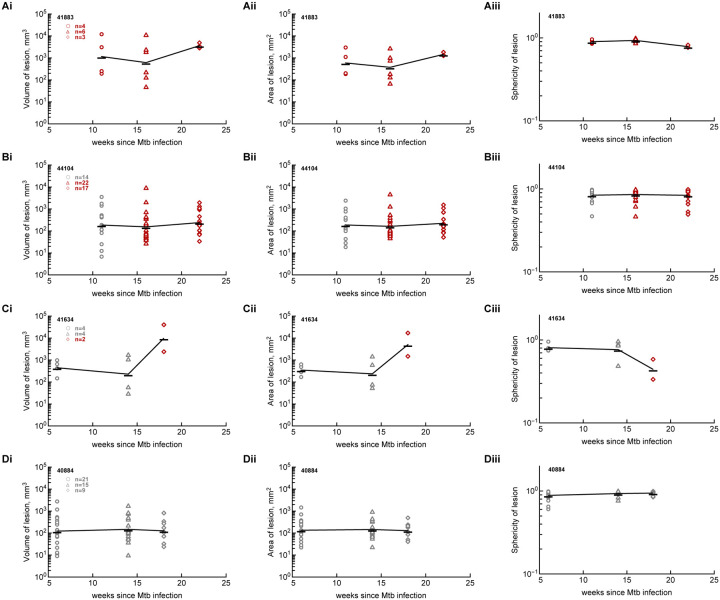
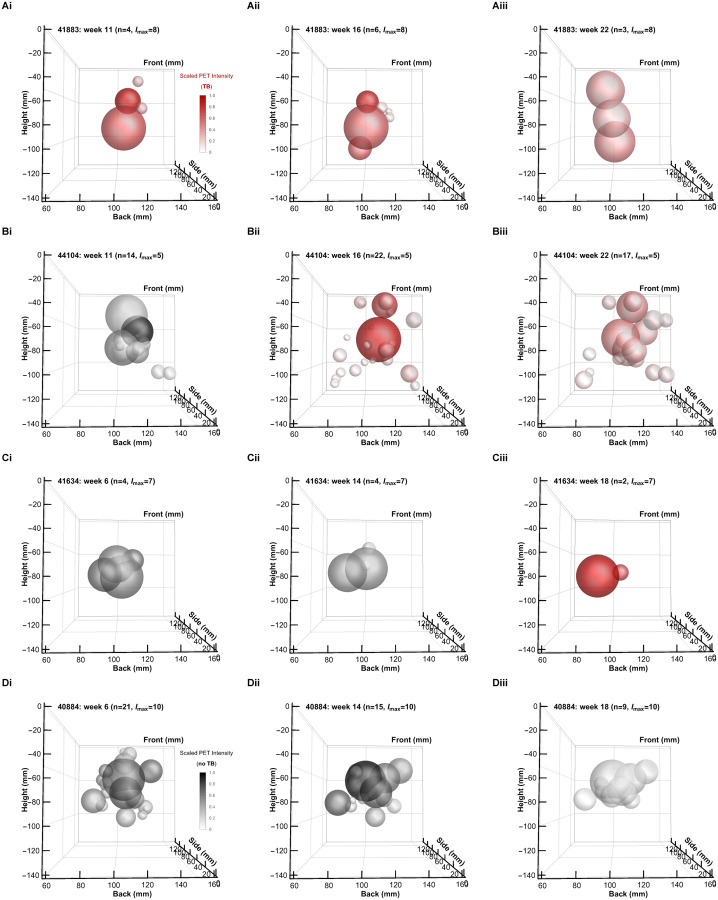
Aerosol exposure of non-human primates (NHPs) to Mycobacterium tuberculosis (Mtb) typically results in discrete sites of inflammation of the lung that is detectable by 2-deoxy-2-[fluorine-18]fluoro-D-glucose (18F-FDG)-based PET/CT scans. Such scans are often analyzed using software such as Invicro VivoQuant or OsiriX as 3D images by manual labeling sites of PET signal using 2D slices and by reporting maximal SUV either of the whole lung or of individual lesions. Here we propose a pipeline for analysis of the same PET/CT scans using Imaris, a proprietary software typically used for analysis of data from fluorescent microscopy experiments. We show that by using locations of spine vertebra (denoted as "landmarks") we can align serials scans of the same animal, and by using automated (with some manual corrections) image segmentation in 3D as "surfaces", we can accurately define location of all sites of inflammation in the lung and lung-associated thoracic lymph nodes (LNs). We show that there is an excellent correlation between individual lesion's maximum SUV determined by Invicro VivoQuant and maximum intensity determined by Imaris suggesting utility of this approach. Imaris also provides wealth of additional information for each of the identified lesions such as volume, location, shape, surface area, and others, and each lesion can be exported in Virtual Reality file format (.wrl) allowing for detailed and rigorous analyses of how features of these PET-defined lesions evolve over time and correlate with the outcome of infection and/or treatment.
Keywords: Imaging data; Imaris; PET tracers; PET/CT; SUV; radioactivity.
Figures
Similar articles
-
PET-CT for assessing mediastinal lymph node involvement in patients with suspected resectable non-small cell lung cancer.Cochrane Database Syst Rev. 2014 Nov 13;2014(11):CD009519. doi: 10.1002/14651858.CD009519.pub2. Cochrane Database Syst Rev. 2014. PMID: 25393718 Free PMC article.
-
123I-MIBG scintigraphy and 18F-FDG-PET imaging for diagnosing neuroblastoma.Cochrane Database Syst Rev. 2015 Sep 29;2015(9):CD009263. doi: 10.1002/14651858.CD009263.pub2. Cochrane Database Syst Rev. 2015. PMID: 26417712 Free PMC article.
-
Cost-effectiveness of using prognostic information to select women with breast cancer for adjuvant systemic therapy.Health Technol Assess. 2006 Sep;10(34):iii-iv, ix-xi, 1-204. doi: 10.3310/hta10340. Health Technol Assess. 2006. PMID: 16959170
-
Is 18 F-fluoride PET/CT an Accurate Tool to Diagnose Loosening After Total Joint Arthroplasty?Clin Orthop Relat Res. 2025 Mar 1;483(3):415-428. doi: 10.1097/CORR.0000000000003228. Epub 2024 Sep 11. Clin Orthop Relat Res. 2025. PMID: 39293088
-
Comparison of Two Modern Survival Prediction Tools, SORG-MLA and METSSS, in Patients With Symptomatic Long-bone Metastases Who Underwent Local Treatment With Surgery Followed by Radiotherapy and With Radiotherapy Alone.Clin Orthop Relat Res. 2024 Dec 1;482(12):2193-2208. doi: 10.1097/CORR.0000000000003185. Epub 2024 Jul 23. Clin Orthop Relat Res. 2024. PMID: 39051924
References
-
- (GTB), G. T. P. 2023. Global tuberculosis report 2023. Https://iris.who.int/bitstream/handle/10665/379339/9789240101531-eng.pdf....
-
- Comstock G. W., Livesay V. T. & Woolpert S. F. 1974. The prognosis of a positive tuberculin reaction in childhood and adolescence. Am J Epidemiol, 99(2), 131–138. - PubMed
-
- Sutherland I. 1976. Recent studies in the epidemiology of tuberculosis, based on the risk of being infected with tubercle bacilli. Advances in tuberculosis research. Fortschritte der Tuberkulose-forschung. Progres de l’exploration de la tuberculose, 19, 1–63. - PubMed
Publication types
Grants and funding
LinkOut - more resources
Full Text Sources