[Preprint]. 2025 Jul 24:2025.07.11.659973.
doi: 10.1101/2025.07.11.659973.

Context-dependent regulatory variants in Alzheimer's disease

Affiliations

Context-dependent regulatory variants in Alzheimer's disease

Ziheng Chen et al. bioRxiv. .

Abstract

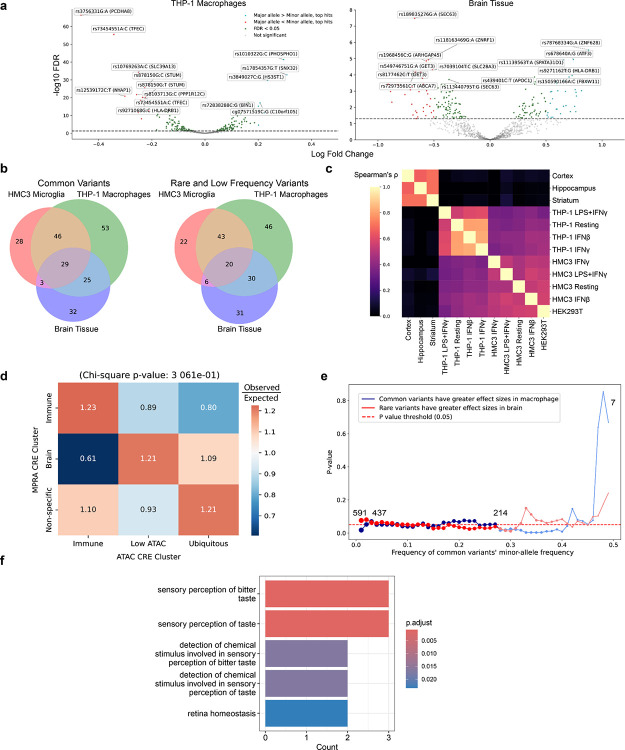
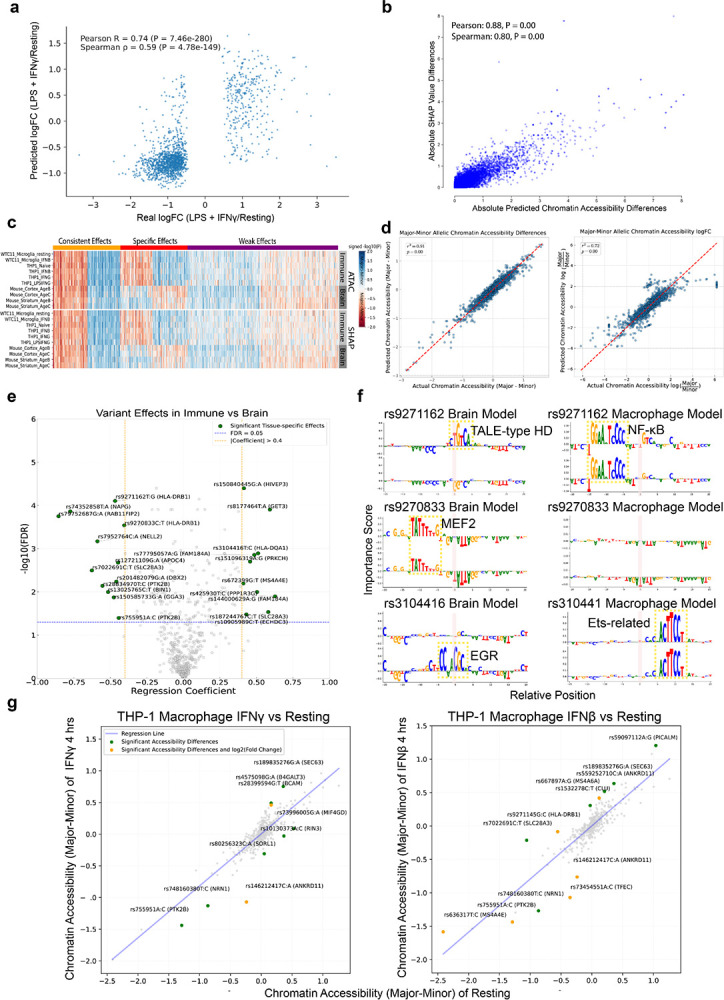
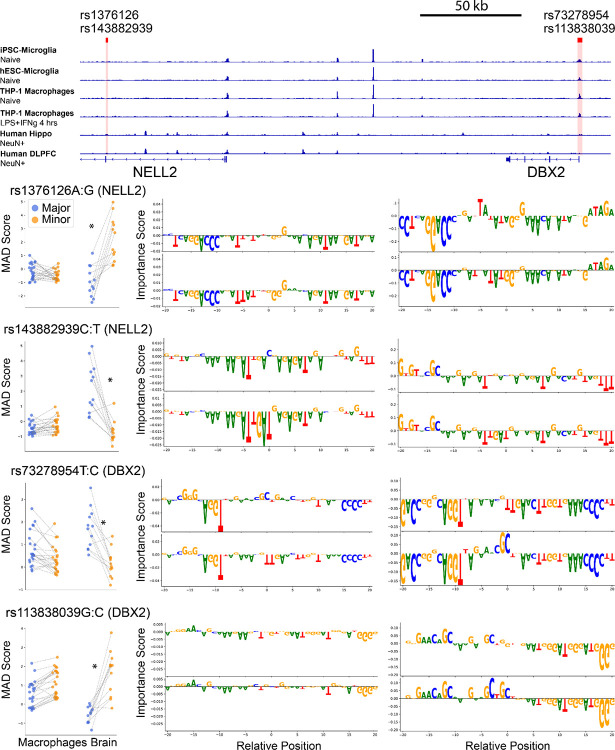
Noncoding genetic variants underlie many complex diseases, yet identifying and interpreting their functional impacts remains challenging. Late-onset Alzheimer's disease (LOAD), a polygenic neurodegenerative disorder, exemplifies this challenge. The disease is strongly associated with noncoding variation, including common variants enriched in microglial enhancers and rare variants that are hypothesized to influence neurodevelopment and synaptic plasticity. These variants often perturb regulatory sequences by disrupting transcription factor (TF) motifs or altering local TF interactions, thereby reshaping gene expression and chromatin accessibility. However, assessing their impact is complicated by the context-dependent functions of regulatory sequences, underscoring the need to systematically examine variant effects across diverse tissues, cell types, and cellular states. Here, we combined in vitro and in vivo massively parallel reporter assays (MPRAs) with interpretable machine-learning models to systematically characterize common and rare variants across myeloid and neural contexts. Parallel profiling of variants in four immune states in vitro and three mouse brain regions in vivo revealed that individual variants can differentially and even oppositely modulate regulatory function depending on cell-type and cell-state contexts. Common variants associated with LOAD tended to exert stronger effects in immune contexts, whereas rare variants showed more pronounced impacts in brain contexts. Interpretable sequence-to-function deep-learning models elucidated how genetic variation leads to cell-type-specific differences in regulatory activity, pinpointing both direct transcription-factor motif disruptions and subtler tuning of motif context. To probe the broader functional consequences of a locus prioritized by our reporter assays and models, we used CRISPR interference to silence an enhancer within the SEC63-OSTM1 locus that harbors four functional rare variants, revealing its gatekeeper role in inflammation and amyloidogenesis. These findings underscore the context-dependent nature of noncoding variant effects in LOAD and provide a generalizable framework for the mechanistic interpretation of risk alleles in complex diseases.


Conflict of interest statement

Competing Interests None.

Figures

Extended Data Fig. 1 |
Extended Data Fig. 1 |. Epigenomic characterization of stimulated THP-1 macrophages as a microglial model.
(a) Differentiation of THP-1 monocytes into macrophages, confirmed by reduced cell cycle-related pathways and elevated immune response pathways in ATAC-seq and RNA-seq(FDR < 0.05, DESeq2, fast gene set enrichment analysis). (b) ATAC-seq of THP-1 macrophages stimulated with IFN-β, IFN-γ, or LPS+IFN-γ shows distinct regulatory responses, including promoter opening and closing (padj < 0.05, DESeq2). (c) Principal component analysis (PCA) of open chromatin profiles of THP-1 macrophages stimulated with IFN-β, IFN-γ, or LPS+IFN-γ. (d) Pathway analyses of promoters with gained accessibility under each stimulation highlight antiviral (IFN-β) and M1 polarization pathways (IFN-γ) and defense responses (LPS+IFN-γ) (FDR < 0.05, fast gene set enrichment analysis). (e) Stratified LD-score regression (S-LDSC) reveals significant enrichment of LOAD risk variants in chromatin accessible in THP-1 macrophages, comparable to primary or hESC/iPSC-derived microglia, but not in neurons or HMC3/HEK293T cells. (f) PCA of open chromatin profiles confirms that THP-1 macrophages resemble iPSC/hESC-derived microglia, whereas HMC3 is closer to immortalized cell lines. These findings validate THP-1 macrophages as a practical model for dissecting LOAD-associated immune mechanisms.
Extended Data Fig. 2 |
Extended Data Fig. 2 |. Transcriptomic profiling and microglial marker validation in THP-1 macrophages.
(a) Differential expression analyses confirm significant up- or downregulated genes under various stimulation conditions (FDR < 0.05, DESeq2). (b) Gene set enrichment analyses of resting and stimulated THP-1 macrophages reveal immune-related shifts (IFN-β, IFN-γ, LPS+IFN-γ) that mirror ATAC-seq changes in Extended Data Fig. 1. (FDR < 0.05, fast gene set enrichment analysis). (c) PCA of RNA-seq data shows distinct transcriptomic clusters for each state, reflecting diverse immune states. (d) Microglial and macrophage markers were expressed in all conditions. (e) Differential expression of microglial-state marker genes (Sun et al.) in stimulated THP-1 macrophages versus non-marker genes (two-sided Mann-Whitney U, Benjamini-Hochberg correction). Significance codes, Benjamini-Hochberg FDR: **** < 1 × 10⁻⁴; *** < 1 × 10⁻³; ** < 1 × 10⁻²; * < 0.05; NS, not significant. (f) Transcriptomic concordance between LPS + IFN-γ-stimulated THP-1 macrophages and amyloid-fibril-treated iPSC-microglia. Pearson’s r is calculated on the expression levels of genes that are differentially expressed in the amyloid-fibril model (Sun et al.).
Extended Data Fig. 3 |
Extended Data Fig. 3 |. MPRA reproducibility, cell-type clustering, and motif contributions to LPS+IFN-γ-responsive enhancers.
(a) Biological replicates show high concordance in MPRA activity (Pearson’s r ≈ 0.8–0.9 in vitro, r ≈ 0.6–0.7). t-SNE analysis of CRE enhancer activities reveals distinct clustering by cell type. (b) Approximately 12.5% of the tested candidate cis-regulatory elements (CREs) are active (MPRAnalyze quantitative analysis, P.MAD.Score < 0.1) in both macrophages and mouse brain regions. (c) Coefficients of HOCOMOCO transcription factor motifs in elastic net models that predict MAD scores of LPS+IFN-γ-treated THP-1 macrophages and resting THP-1 macrophages. Regression outliers highlighted in red have residuals greater than 3-fold the standard deviation. (d) Deep-learning models trained on LPS+IFN-γ responsive ATAC-seq peaks (DESeq2, padj < 0.05) identify TF motifs positively and negatively enriched among LPS+IFN-γ responsive MPRA enhancers. NF-κB, IRF/STAT, and CG-rich motifs contribute to increased accessibility, whereas SPI1 and C/EBP motifs correlate with decreased accessibility (TF-MoDISco, motif q-value < 0.05). (e) Deep-learning models trained on ATAC-seq data identify cell-type-specific TF motifs enriched among active MPRA enhancers, confirming motif-driven transcriptional regulation (TF-MoDISco, motif q-value < 0.05).
Extended Data Fig. 4 |
Extended Data Fig. 4 |. Context-dependent functional impacts of LOAD-associated genetic variants.
(a) Volcano plots of significantly functional common and rare LOAD variants identified by MPRA in THP-1 macrophages and mouse brain tissue (MPRAnalyze comparative analysis, FDR < 0.05). Variants highlight cell-type specificity and effect-size distributions of regulatory effects. (b) Venn diagram illustrating overlaps of expression-modulating variants identified across THP-1 macrophages, HMC3 microglia, and mouse brain. (c) Variant effects quantified by MPRA reveal cell-type-specific impacts. Spearman correlation coefficients (P < 0.05) are higher between similar cell types and lower between distinct cell types, emphasizing cell-type specificity. (d) Variants show a visible trend of segregating into immune-, brain-, or nonspecific categories consistent with their CRE annotations, but this distribution does not reach statistical significance (Chi-squared test, p > 0.05). (e) Common versus rare variant effects on transcriptional regulation in MPRA. Rare variants (minor allele frequency [MAF] < 0.01) have stronger effects in brain tissue; common variants (including low frequency variants, MAF ≥ 0.01) exhibit greater effects in THP-1 macrophages. Highly frequent variants (MAF ≥ 0.1) reinforce this pattern, highlighting distinct roles for rare versus common LOAD variants. Each dot represents an independent one-tailed Mann-Whitney U test; y-axis indicates the test P-value. Dot size represents the ratio of common to rare variants, and the number of common variants at critical points is displayed. Dark blue/red: more common than rare variants (rare MAF ≤ 0.2); light blue/red: fewer common than rare variants (rare MAF > 0.2). (f) Genes regulated by distal enhancers that contain functionally causal variants are enriched in sensory-related pathways (fGSEA, FDR < 0.05).
Extended Data Fig. 5 |
Extended Data Fig. 5 |. Machine-learning models identify cell-type- and immune-state-specific variant effects.
(a) Convolutional neural network (CNN) models trained on LPS+IFN-γ-responsive peaks (differentially accessible regions in ATAC-seq, DEseq2, FDR < 0.05) in THP-1 macrophages. The model showed good performance on the validation dataset (Pearson’s r, 0.74). (b) Model-derived accessibility changes significantly correlate with SHAP importance scores (Pearson’s r, 0.88), validating the approach for identifying regulatory variants. (c) In silico mutagenesis reveals allelic effects of LOAD variants, including consistent, specific, and weak effects. P-values calculated based on differences in predicted chromatin accessibility and SHAP values between major and minor alleles relative to cell-type-specific null distributions. (d,e) Linear regression across multiple machine learning predictions of chromatin accessibility differences and log fold changes captures immune-versus neuronal-specific variant effects. (f) Examples of variants in HLA-DRB1 and HLA-DQA1 show unexpectedly strong neuronal effects (SHAP values visualized by logomaker). (g) Independent linear regressions of model-predicted effect sizes across two immune states (resting, IFN-γ, IFN-β) show variants with state-specific activity. Variants whose standardized residuals exceed 3-fold standard deviation (two-tailed P < 0.01) are classified as IFN-γ-specific, IFN-β-specific, or brain-region-specific.
Extended Data Fig. 6 |
Extended Data Fig. 6 |. Rare variants in NELL2 and DBX2 highlight neuronal-specific regulatory outcomes.
Two rare variants in the NELL2 locus (rs1376126, rs143882939) display no significant effect in THP-1 macrophages but show contrasting allelic activity in mouse hippocampus, cortex, and striatum, demonstrating neuronal-context specificity (*FDR<0.05, MPRAnalyze comparative analysis). Machine learning models do not capture motifs that positively contribute to chromatin accessibility (SHAP scores by TF-MoDISco). Nearby variants in the DBX2 promoter (rs73278954, rs113838039) have measurable effects in both macrophages and brain tissue. Collectively, these findings emphasize how rare LOAD variants can selectively affect neuronal enhancers while also exerting cross-cell-type regulatory functions in certain contexts.
Extended Data Fig. 7 |
Extended Data Fig. 7 |. Synthetic enhancer tiling and motif shuffling for BIN1 in THP-1 macrophage MPRA.
Synthetic enhancer tiling and 25 bp motif shuffling around rs6733839 at the BIN1 locus illustrate how combinatorial interactions determine whether the motif context around exerts an activating or repressive effect. MAD scores quantify transcriptional activity (MPRAnalyze quantitative analysis), and motif-allele differences are evaluated by MPRAnalyze comparative analyses, respectively (*FDR<0.05, MPRAnalyze comparative analysis). When the motif context pairs only with upstream motifs (rs6733839_Enhancer1), the CRE behaves as an enhancer. When paired with both upstream and downstream motifs (rs6733839_Enhancer2), it is embedded in a repressive CRE but still confers partial activation. When paired only with downstream motifs (rs6733839_Enhancer3), it acts repressively within a repressive CRE. Removing the rs6733839 motif context while retaining downstream motifs (rs72838288_Enhancer1) produces a net activating enhancer. These observations suggest that the rs6733839 motif context provides a repressive function in combination with downstream motifs but becomes activating when upstream motifs are present, with the net effect ultimately dominated by its combination with downstream sequences.
Extended Data Fig. 8 |
Extended Data Fig. 8 |. Chromatin architecture and functional consequences of CRISPRi targeting the SEC63-OSTM1 enhancer.
(a) Hi-C in THP-1 macrophages (<5-kb resolution) places the enhancer (black bar) in the same contact domain as the SEC63 promoter and shows a looping interaction with the OSTM1 promoter and a CTCF anchor in the intronic regions of AFG1L. (b) Three-dimensional chromatin model of the SEC63-OSTM1 enhancer and nearby genes. (c) SEC63, the enhancer, and OSTM1 knockdown in hyperinflammatory (LPS + IFN-γ-treated) THP-1 macrophages. (d) CRISPRi knockdown of the SEC63 and OSTM1 promoters perturbs distinct transcriptional pathways in resting and hyperinflammatory (LPS + IFN-γ-treated) THP-1 macrophages (fgsea, FDR<0.05). (e) Expression of the microglial-state marker genes defined by Sun et al. after CRISPRi. Silencing SEC63 shifts multiple microglial programs, and these shifts are amplified under LPS + IFN-γ-highlighting a central role for SEC63 in state transitions and immune responses.
Fig. 1 |
Fig. 1 |. Integrative framework for identifying context-dependent regulatory effects of LOAD-associated variants.
(a) Manhattan plot of 599 prioritized late-onset Alzheimer’s disease (LOAD) variants, comprising common and rare variants from genome-wide association studies (GWAS) and whole-genome sequencing (WGS) of familial LOAD cases. Variants were selected based on their statistical association strength and overlap with open chromatin regions in brain and immune cell types. (b) Variants were mapped to regions classified by chromatin accessibility annotations across immune and neuronal cell types and states, derived from bulk and single-nucleus ATAC-seq (Supplementary Table 3), then grouped as immune-specific cis-regulatory elements (CREs), ubiquitously accessible CREs, or regions with low accessibility. The accompanying bar plot summarizes the genomic context of these variants, showing the percentage that fall within 1–5 kb to transcription start site (TSS), promoter, 5’ untranslated regions (5’ UTR), exons, introns, 3’ untranslated regions (3’ UTR), and intergenic regions. (c) Overview of the experimental and computational pipeline for functional interpretation of noncoding variants. Massively parallel reporter assays (MPRAs) in multiple cell types and states validate regulatory activity and motif context. Convolutional neural networks trained on multi-cell-type, multi-state ATAC-seq data identify putative regulatory variants and transcription factor motifs. CRISPRi perturbation of the SEC63-OSTM1 locus followed by RNA-seq reveals downstream gene expression and pathway changes, linking regulatory variants to LOAD-relevant molecular mechanisms.
Fig. 2 |
Fig. 2 |. Context-dependent MPRA identified LOAD-risk enhancers across neuronal and immune contexts.
(a) Schematic of the massively parallel reporter assay (MPRA) design. Synthetic 227-bp candidate cis-regulatory elements (CREs) downstream of a minimal promoter that drives the expression of mCherry, each tagged with unique barcodes for quantification. CREs were either open chromatin peak-centered on or variant-centered, with additional motif-disrupted constructs generated by sequence shuffling around selected variants (b) Reporter libraries were systemically delivered in vivo to the mouse brain tissues (cortex, hippocampus, and striatum) via AAV.PHP.eB viral retro-orbital injection, and transfected in vitro into THP-1 macrophages and HMC3 microglia-like cells under resting, IFN-β, IFN-γ, and LPS+IFN-γ conditions. (c) CRE enhancer activities show both cell-type- and immune-state-specific patterns. MPRA activity is quantified using cDNA:DNA ratios and modeled via median absolute deviation (MAD) scores (MPRAnalyze quantitative analysis, see methods). MAD scores reveal strong correlations among similar cell types and conditions (Pearson correlation), whereas LPS+IFN-γ stimulation yields more distinct activity profiles and lower correlations with other immune states. This figure mixes scatter plots, histograms of MAD scores, and a heatmap of MAD score correlations. (d) Immune and ubiquitous CREs (defined in Fig. 1b) exhibit higher activity in THP-1 macrophages, and immune CREs also display elevated activity in brain tissue (P.MAD, MPRAnalyze quantitative analysis). (e) Coefficients of HOCOMOCO transcription factor motifs in elastic net models that predict MAD scores of THP-1 macrophage MPRA or brain tissue MPRA. Regression outliers highlighted in red have residuals greater than 3-fold the standard deviation. (f) Clustering of cell-type-specific and broadly active enhancers. The heatmap depicts Z-normalized reporter transcription activity for each candidate CRE (columns) across the assayed cell types/conditions (rows). For every enhancer, reporter activity was quantified as the mean MAD score of its reference and alternate-allele constructs, then standardized within each cell type by dividing by that cell type’s standard deviation to yield a Z-score. Only enhancers with |Z| ≥ 1.65 (≈ 95th percentile) in at least one context are shown, highlighting elements with strong cell-type-specific or broadly shared activity. Unsupervised hierarchical clustering (Euclidean distance, average linkage) organizes both enhancers and cell types; warmer colors indicate higher activity and cooler colors lower activity. (g) CRE responses to LPS+IFN-γ stimulation in THP-1 macrophages; most responsive CREs exhibit repression upon stimulation (FDR < 0.05, MPRAnalyze comparative analysis, see methods). Volcano plots show the log fold change of CRE enhancer activities in stimulated THP-1 macrophages versus resting THP-1 macrophages at the X-axis and −log10 (FDR) at the Y-axis. (h) Genes proximal to LPS+IFN-γ-responsive CREs enriched in immune activation pathways (FDR < 0.05, fast gene set enrichment analysis).
Fig. 3 |
Fig. 3 |. Allele frequency, cellular context, and immune state modulate TF-motif-driven variant effects on enhancer activity.
(a) Clustering of LOAD variants with significant impacts (FDR < 0.05, MPRAnalyze comparative analysis) on active enhancers (P.MAD < 0.1, MPRA quantitative analysis). Brain-specific, immune-specific, and nonspecific effects were observed. (b) Comparison of MPRA-derived effect sizes between rare (minor allele frequency [MAF] < 0.01) and common (MAF ≥ 0.29) variants in THP-1 macrophages and mouse brain tissue. Common variants exert stronger effects in macrophages, whereas rare variants show greater transcriptional consequences in the brain (P-value, one-tailed Mann-Whitney U test). (c) TF motif-enrichment of the sequence context around significant expression-modulating variants (emVars) highlights distinct TF families in each cell type. Motif analysis was performed using AME (MEME Suite) to identify TF families enriched in the 25 bp sequence context surrounding MPRA-validated emVars (q < 0.05), separately for each cell type. Results are compared to motif enrichment in cell-type-specific ATAC-seq peaks from THP-1 macrophages and brain tissues (Cortex and Striatum). Similar TF family enrichment patterns were observed in both datasets, with cell-type-specific TFs identified in ATAC-seq showing comparable enrichment around MPRA-significant variants in the corresponding cell type. (d) Comparison of CRE enhancer activities between constructs harboring single-nucleotide variants and those with shuffled motif sequences. Motif disruption causes significantly stronger transcriptional perturbations than SNVs in several key transcription factor (TF) families, including STAT, IRF, AP-1, MEF2, and SPI1 (FDR ≤ 0.05, one-tailed Wilcoxon signed-rank test). ns, not significant (FDR > 0.05) (e) Disrupted motif contexts show directional regulatory effects: disruptions that decreased transcription mark the motif as an activator, whereas disruptions that increased transcription mark it as a repressor. Motifs such as IRF, SPI1, and STAT often correlate with increased transcriptional activity, suggesting their roles as activating factors. (f) Variants exhibit distinct transcriptional responses under hyperinflammatory state (LPS+IFN-γ) (FDR < 0.05, MPRAnalyze comparative analysis). The Y and X axes represent the log fold change of CRE enhancer activities of the major allele versus the minor allele in LPS+IFN-γ-treated and resting THP-1 macrophages, respectively.
Fig. 4 |
Fig. 4 |. Machine-learning models interpret cell-type- and state-specific regulatory effects of LOAD variants.
(a) Convolutional neural network (CNN) models are trained on ATAC-seq data from multiple immune and neuronal cell types and states to predict chromatin accessibility. These models achieve high accuracy on closely related cell types (Spearman’s ρ ≈ 0.8) and moderate performance across more divergent types (ρ ≈ 0.5), indicating context specificity. (b) TF-MoDISco motif analysis identifies cell-type- and state-specific transcription factor (TF) motifs based on SHAP importance scores from each model’s predictions (q-value < 0.05). These motifs form combinatorial modules that collectively yield distinct regulatory signatures. (c) Models trained in immune versus neuronal contexts differentially predict accessibility of LOAD variant-containing sequences, distinguishing immune-specific, ubiquitous, and low-accessibility regions. Predictions from different models are aggregated: macrophage/microglia models (THP-1 macrophages, iPSC-derived microglia, and hESC-derived microglia) and brain-region models (cortex and striatum). (d) The 50 variants predicted to most strongly alter chromatin accessibility induce markedly larger transcriptional changes in MPRA than the 50 variants predicted to have minimal impact (one-tailed Wilcoxon rank-sum test). (e) Integrating predicted accessibility and SHAP scores identifies top variants that disrupt CTCF motifs or exert immune-specific and neuron-specific effects. P-values calculated based on differences in predicted chromatin accessibility and SHAP values between major and minor alleles relative to cell-type-specific null distributions. (f) Linear regression of allele-specific effect sizes across paired cell-type models pinpoints variants with significant cell-type-selective activity (FDR < 0.05). Two patterns emerge: (i) magnitude-shift variants exert the same directional effect in immune and neuronal cells but with different strengths, and (ii) direction-switch variants flip between activation and repression across the two lineages. emVars detected in THP-1 macrophage MPRA, brain MPRA, or both are annotated with triangles, squares, and asterisks, respectively. (g) Linear regression of allelic effect sizes in immune-state-specific models shows variants with enhanced or diminished regulatory effects in the hyperinflammatory state (LPS+IFN-γ, FDR < 0.05). (h) Condition-specific regulatory variants. rs73972710 (C:T) at CTDP1—the major C allele forms a repressive ZBTB-family motif that dampens transcription in resting cells, whereas the T allele disrupts the motif and lifts repression. Under hyperinflammatory conditions, chromatin opening around the major allele masks its resting-state repression, reducing allelic differences. SHAP logos visualize the motif gains and losses that drive these state-specific effects.
Fig. 5 |
Fig. 5 |. Functional regulatory variants.
(a) Genome-wide map of rare, low-frequency, and common expression-modulating variants (emVars) that simultaneously perturb transcription (MPRA) and chromatin accessibility (model predictions). Spatial clustering of these dual-effect alleles marks convergent regulatory hotspots, loci harboring multiple functionally active variants. Dots are colored by the direction of the transcriptional effect (red, minor < major; blue, minor > major). Variants shown satisfy FDR < 0.05 in the MPRA allelic comparison, and |log2FC| > 0.1 and FDR < 0.01 in predicted accessibility differences. (b) Proposed mechanistic model illustrating how genetic variants modulate transcription via multiple mechanisms. Variants can disrupt or create transcription factor (TF) motifs, alter local TF binding affinity, or influence competitive interactions among TFs, collectively shaping transcriptional output. Motif shuffling abolishes local TF binding, clarifying variant mechanisms. (c) Criteria-based selection of functional causal variants from MPRA data, categorized by higher or lower transcriptional activity of the major allele relative to the minor allele in THP-1 macrophages, HMC3 microglia-like cells, and mouse brain. Red: variants supported by motif shuffling. Bold: variants predicted to significantly alter chromatin accessibility (FDR < 0.01, two-tailed Wilcoxon signed-rank test on Bayesian predictions using Monte Carlo dropout; logFC accessibility difference magnitude > 0.1).
Fig. 6 |
Fig. 6 |. Mechanistic interpretation of causal variants at BIN1, MS4A, and SEC63-OSTM1 loci.
(a) Selected functionally causal variants at BIN1, MS4A, and SEC63-OSTM1 loci and their regulatory effects across cell types. Cells are colored only when the allelic effect is significant within a significantly active enhancer (MPRAnalyze, FDR < 0.05, |P.MAD| > 0.1): red indicates reduced transcription from the minor allele, green indicates increased transcription. Uncolored cells reflect significant allelic effects observed in enhancers that do not meet the activity threshold. (b) BIN1 locus. Four microglia-active variants cluster in two adjacent enhancers. In enhancer 1, rs6733839 is predicted to strengthen an SPI1 site in immune cells or create an MEF2 site in neurons, yet the minor allele T represses transcription in THP-1 macrophage MPRA, implying SPI1-induced silencing in THP-1 macrophages. Enhancer 2 contains rs13025765 and rs13025717: rs13025765 flips direction between THP-1 macrophage (repression) and brain tissue (activation), reflecting SPIB- versus RFX-driven regulation, whereas rs13025717 disrupts a SP/KLF motif, lowering both transcription and predicted chromatin accessibility in THP-1 macrophages. (c) MS4A6E intron. An enhancer harbors three functional variants. The minor T allele of rs10897049 strengthens an ETS motif and elevates transcription in macrophages. Conversely, in brain tissue, rs4477457-A disrupts an E2F motif, lowering activity, while rs10792265-G creates an RFX site that likely competes with E2F, further repressing expression. In THP-1 macrophages, these two alleles increased transcription activity, but models did not reveal TF motif differences. (d) SEC63/OSTM1 enhancer. Four rare variants produced distinct MPRA readouts. The minor A allele of rs147038704 strengthens an SPI1 motif in THP-1 macrophages yet suppresses transcription in both THP-1 macrophages and mouse brain. The minor T allele of rs115607757 weakens a bZIP motif in THP-1 macrophages, lowering transcription in macrophages but elevating it in the brain. The minor C allele of rs189835276 disrupts an ETS-related motif and consistently increases transcription in both cell types. (e) CRISPR interference experiments highlight the functional enhancer from panel d. Targeting this enhancer with dCas9-KRAB in resting THP-1 macrophages leaves SEC63 and OSTM1 transcripts unchanged yet significantly up-regulates GSAP and SSH1 (DESeq2, adj. P < 0.05). In contrast, silencing the SEC63 promoter provokes a broader secondary response, also elevating GSAP. (f) Pathway enrichment of the CRISPRi RNA-seq data (fGSEA, FDR < 0.05) reveals state-specific effects of enhancer silencing: in the resting state, it elevates complement signaling and suppresses proliferative programs (E2F, G2M checkpoint, MYC), whereas under LPS+IFN-γ stimulation, it strengthens TNFα–NF–κB, Notch, and KRAS-up signatures and further represses E2F targets. Asterisks in panels b-d denote variants whose allelic MPRA comparison is significant at FDR < 0.05. Brain model prediction represents the averaged SHAP values from cortex and striatum models.

References

    1. Rabinovici G. D. Late-onset Alzheimer Disease. Contin.: Lifelong Learn. Neurol. 25, 14–33 (2019). - PMC - PubMed
    1. Liu C.-C., Liu C.-C., Kanekiyo T., Xu H. & Bu G. Apolipoprotein E and Alzheimer disease: risk, mechanisms and therapy. Nat. Rev. Neurol. 9, 106–118 (2013). - PMC - PubMed
    1. Wightman D. P. et al. A genome-wide association study with 1,126,563 individuals identifies new risk loci for Alzheimer’s disease. Nat Genet 53, 1276–1282 (2021). - PMC - PubMed
    1. Jansen I. E. et al. Genome-wide meta-analysis identifies new loci and functional pathways influencing Alzheimer’s disease risk. Nat Genet 51, 404–413 (2019). - PMC - PubMed
    1. Bellenguez C. et al. New insights into the genetic etiology of Alzheimer’s disease and related dementias. Nat. Genet. 54, 412–436 (2022). - PMC - PubMed

Publication types