[Preprint]. 2025 Jul 11:2025.07.11.662657.
doi: 10.1101/2025.07.11.662657.

Unravelling the role of epigenetic regulators during embryonic development of Rhipicephalus microplus

Affiliations

Unravelling the role of epigenetic regulators during embryonic development of Rhipicephalus microplus

Anderson Mendonça Amarante et al. bioRxiv. .

Abstract

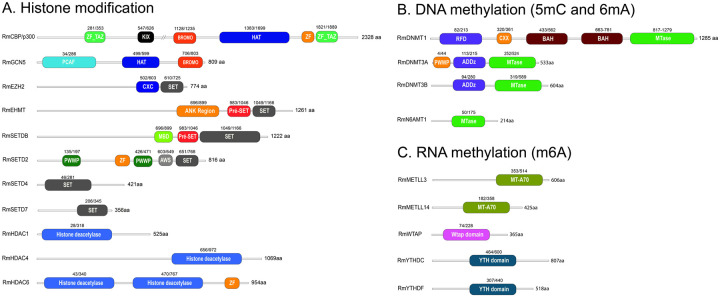
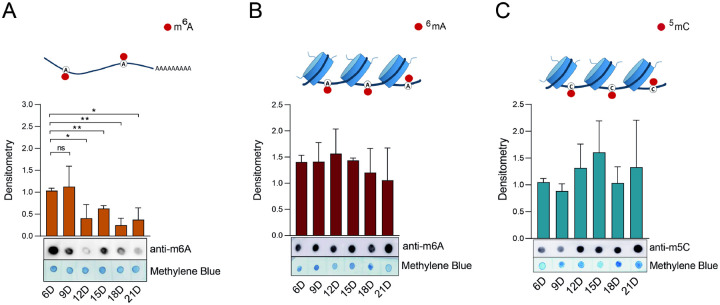
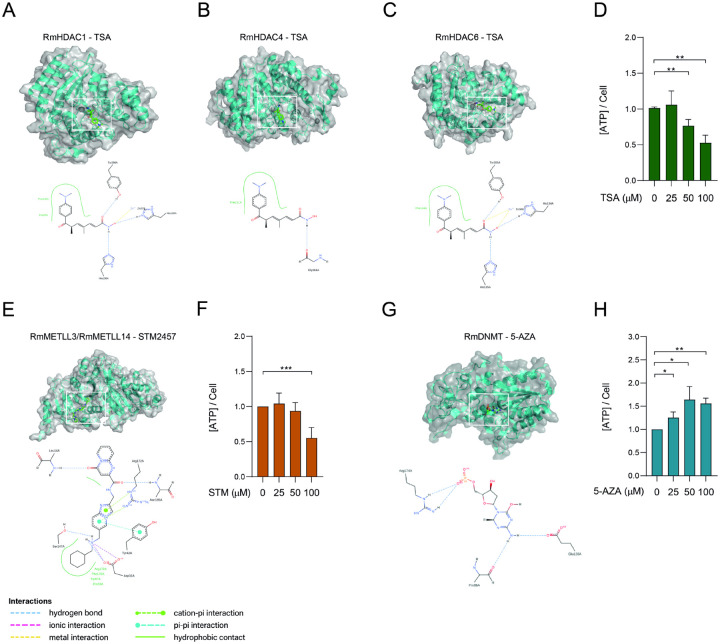
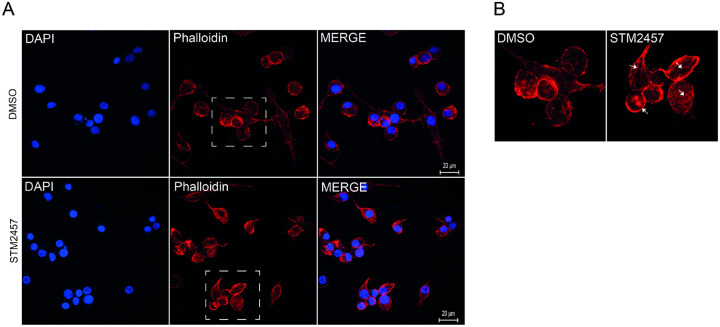
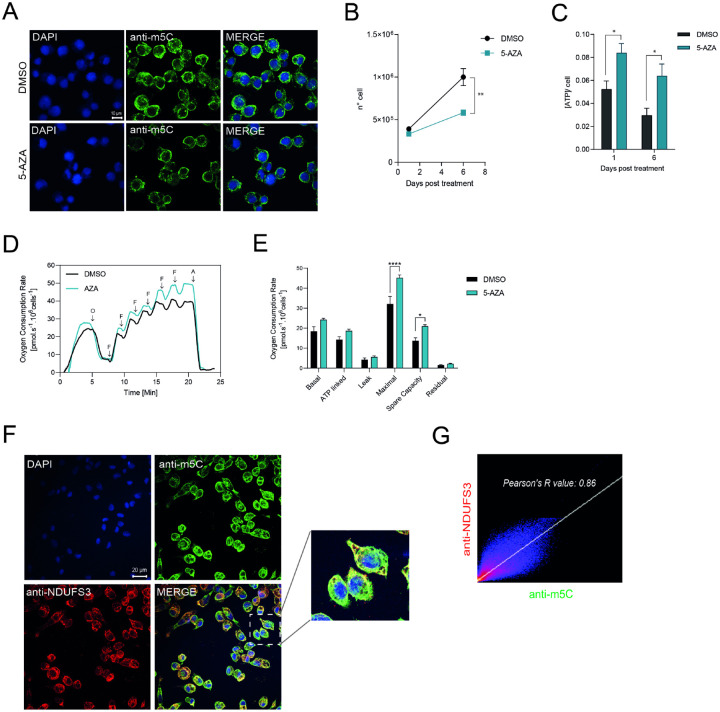
Epigenetic modifications are long-lasting changes to the genome that influence a cell's transcriptional potential, thereby altering its function. These modifications can trigger adaptive responses that impact protein expression and various cellular processes, including differentiation and growth. The primary epigenetic mechanisms identified to date include DNA and RNA methylation, histone modifications, and microRNA-mediated regulation of gene expression. The intricate crosstalk among these mechanisms makes epigenetics a compelling field for the development of novel control strategies, particularly through the use of epigenetic drugs targeting arthropod vectors such as ticks. In this study, we identified the Rhipicephalus microplus orthologs of canonical histone-modifying enzymes, along with components of the machinery responsible for m5C and 6mA-DNA, and m6A-RNA methylations. We further characterized their transcriptional profiles and enzymatic activities during embryonic development. To explore the functional consequences of epigenetic regulation in R. microplus, we evaluated the effects of various epigenetic inhibitors on the BME26 tick embryonic cell line. Molecular docking simulations were performed to predict the binding mode of these inhibitors to tick enzymes, followed by in vitro assessment of their effects on cell viability and morphology. Tick cells exposed to these inhibitors exhibited phenotypic and molecular alterations. Notably, we observed higher levels of DNA methylation in the mitochondrial genome compared to nuclear DNA. Inhibition of DNA methylation using 5'-azacytidine (5'-AZA) was associated with increased activity of the mitochondrial electron transport chain and ATP synthesis, but reduced cellular proliferation. Our findings highlight the importance of epigenetic regulation during tick embryogenesis and suggest that targeting these pathways may offer a novel and promising strategy for tick control.


Figures

Figure 1.
Figure 1.. Conserved domains in epigenetic regulators of Rhipicephalus microplus.
The domain architecture of epigenetic regulators in R. microplus is shown in A-C, with gene accession numbers listed in Supplemental Table 3. A comparative analysis of full-length amino acid sequences, including functional domain annotations, between R. microplus epigenetic regulators and their mammalian counterparts is provided in Figure S1, A–Q).
Figure 2.
Figure 2.. Embryonic development of Rhipicephalus microplus.
Developmental stages were visualized using DAPI staining to highlight nuclear morphology. The stages, previously described in the literature, are categorized from stage 1 to stage 14, corresponding to days 0 through 21 of embryogenesis. Due to the lack of enough cells in eggs in the initial stages of development, we conducted experiments using eggs from day 6 (stage 7) to day 21 (stage14). Upper panel: lateral view of the eggs. Bottom panel: dorsal view of the eggs.
Figure 3.
Figure 3.. Transcriptional profile of Rhipicephalus microplus epigenetic regulators during embryonic development.
Enzymes involved in histone modifications (A) were selected based on their well-documented roles in eukaryotic embryogenesis. For m5C DNA methylation (B), expression levels of both de novo and maintenance DNA methyltransferases were analyzed. For m6A RNA methylation (C), the expression of key writer and reader enzymes was evaluated. Elongation factor 1α (ELF) was used as the housekeeping gene for normalization. RT-PCR was performed to assess gene expression, and the amplified products were visualized by agarose gel electrophoresis. Each RT-PCR reaction was independently repeated a minimum of six times to ensure reproducibility.
Figure 4.
Figure 4.. Catalytic activity of Rhipicephalus microplus histone-modifying enzymes during embryonic development.
Chromatin activation (A-C, green bars) and repression (D-E, red bars) were assessed by Western blot analysis using monoclonal antibodies. Western blotting was performed on six independent biological replicates; a representative blot is shown. Histone H3 was used as a loading control. The intensity of the bands was quantified by densitometry analysis plotted as a graph using ImageJ (NIH Software). Error bars represent the standard error of the mean (SEM). Statistical significance was determined using Student’s t-test. p < 0.05 is considered significant (*).
Figure 5.
Figure 5.. Catalytic activity of Rhipicephalus microplus m6A-DNA/RNA (A,B) and m5C-DNA (C) methyltransferases during embryonic development.
Dot blot analyses were performed using six independent biological replicates; one representative blot is shown. Nucleic acids were stained with methylene blue and used as a loading control. Band intensities were quantified by densitometric analysis using ImageJ (NIH), and the results are presented as bar graphs. Error bars indicate the standard error of the mean (SEM). Statistical significance was assessed using Student’s t-test: p < 0.05 (*), p < 0.01 (**). Non-significant differences are indicated as “ns”.
Figure 6.
Figure 6.. Molecular docking of epigenetic inhibitors to their respective target enzymes.
(A-C) Trichostatin A (TSA; green sticks) docked into the substrate tunnel of the histone deacetylases RmHDAC1, RmHDAC4, RmHDAC6. The hydroxamate zinc-chelating moiety coordinates the catalytic Zn2+ ion, while the aromatic “cap” group occupies the enzyme surface groove. Hydrogen bonds to the conserved active site residues are shown as blue dashed lines. (E) Ribbon diagram of the METLL3/METLL14-like heterodimer (α-subunit and β-subunit), in complex with STM2457 (green sticks), docked into the conserved SAM-binding pocket. Key hydrogen bonds (dashed lines) and hydrophobic contacts are highlighted. (G) Docking of 5-azacytidine (5’-AZA) into the active site of DNA methyltransferase RmDNMT residues (dashed lines), and π–π stacking with a neighboring aromatic nucleotides. All panels are rendered in PyMOL; water molecules and non-essential ions were omitted for clarity. (D,F,H) BME26 were incubated with increasing concentrations of TSA, STM2457 or 5’-AZA, respectively, for 48 hours cell viability was evaluated by measuring ATP rates. Error bars indicate the standard error of the mean (SEM). Statistical significance was assessed using Student’s t-test: p < 0.05 (*), p < 0.01 (**).
Figure 7.
Figure 7.. Effect of m6A-RNA methylation inhibition on Rhipicephalus microplus cells.
(A) BME26 cells were treated with either 100 μM STM2457 or DMSO (control) for 48 hours. Nuclei were stained with DAPI, and actin filaments were visualized using Phalloidin. (B) The region highlighted by the square in panel A is enlarged to facilitate visualization of actin fiber organization. Arrows indicate elongated actin filaments observed in cells treated with STM2457.
Figure 8.
Figure 8.. m5C-DNA methylation in the mitochondrial genome of Rhipicephalus microplus.
(A) BME26 cells were treated with 100 μM 5-azacytidine (5’-AZA) for 48 hours to suppress DNA methylation, followed by immunostaining with an anti-m5C monoclonal antibody (green) and nuclear counterstaining with DAPI (blue). Confocal microscopy reveals reduced m5C signal in 5’-AZA-treated cells compared to control confirming effective inhibition of methylation. Scale bar: 10 μm. (B) The number of cells was counted 6 days post 5’-AZA treatment using a Neubauer chamber. (C) BME26 was incubated with 50 μM of 5’-AZA for six days and cell viability was evaluated by measuring ATP rates. (D) High-resolution respirometry of BME26 cells treated or not with AZA. Representative oxygen consumption trace. O: oligomycin; F: FCCP; A: antimycin A. (E) Mitochondrial respiratory parameters derived from the respirometry data. ****p < 0.0001; *p = 0.0156. N = 3, independent cell cultures. Bar graph showing the different components of mitochondrial respiration under various conditions. The parameters include: Basal respiration: The oxygen consumption rate (OCR) under normal, unstimulated conditions, reflecting the energetic demand of the cell at rest. ATP-linked respiration: The portion of OCR directly coupled to ATP synthesis, indicating mitochondrial activity dedicated to energy production. Proton leak (Leak respiration): The residual OCR not coupled to ATP synthesis, representing protons that re-enter the mitochondrial matrix without contributing to ATP production. Maximal respiration: The maximum OCR achieved after uncoupling mitochondrial oxidative phosphorylation, reflecting the total respiratory capacity of the cell. Spare respiratory capacity: The difference between maximal and basal respiration, indicating the cell’s ability to respond to increased energy demand or stress. Non-mitochondrial respiration (Residual): The OCR remaining after inhibition of mitochondrial respiration, representing oxygen consumption by other cellular processes. (F) BME26 cells were incubated with a monoclonal antibody against m5C (green) and a monoclonal antibody targeting NDUFS3, a subunit of Complex I in the mitochondrial respiratory chain (red). Nuclei were stained with DAPI (blue). The square region highlights the merged images showing the overlap between NDUFS3 and m5C DNA methylation signals. (G) Pearson’s correlation coefficient (R-value) was calculated, demonstrating a positive correlation between the m5C signal and mitochondrial localization.

Similar articles

References

    1. Jongejan F., and Uilenberg G. (2004). The global importance of ticks. Parasitology 129. 10.1017/S0031182004005967. - DOI - PubMed
    1. Martins R., Ruiz N., Fonseca R.N. da, Vaz Junior I. da S., and Logullo C. (2018). The dynamics of energy metabolism in the tick embryo. Revista Brasileira de Parasitologia Veterinaria 27, 259–266. 10.1590/s1984-296120180051. - DOI - PubMed
    1. Jonsson N.N. (2006). The productivity effects of cattle tick (Boophilus microplus) infestation on cattle, with particular reference to Bos indicus cattle and their crosses. Vet Parasitol 137, 1–10. 10.1016/j.vetpar.2006.01.010. - DOI - PubMed
    1. David Guerrero F., Lovis L., and Ricardo Martins J. (2012). Acaricide resistance mechanisms in Rhipicephalus (Boophilus) microplus. Rev. Bras. Parasitol. Vet, 1–6. 10.1590/s1984-29612012000100002. - DOI - PubMed
    1. Seixas A., Oliveira P., Termignoni C., Logullo C., Masuda A., and da Silva Vaz I. (2012). Rhipicephalus (Boophilus) microplus embryo proteins as target for tick vaccine. Vet Immunol Immunopathol 148, 149–156. 10.1016/j.vetimm.2011.05.011. - DOI - PubMed

Publication types

LinkOut - more resources