[Preprint]. 2025 Jul 10:2025.07.07.663268.
doi: 10.1101/2025.07.07.663268.

Avoidance engages dopaminergic punishment in Drosophila

Affiliations

Avoidance engages dopaminergic punishment in Drosophila

Fatima Amin et al. bioRxiv. .

Abstract

It was classically suggested that behaviour can cause emotions (Darwin 1872). For example, smiling can make us feel happier, and in rodents the induced patterns of cardiac activity and breathing that are indicative of fear can in turn evoke it (Coles et al. 2022, Hsueh et al. 2023, Jhang et al. 2024). However, the adaptive significance of such feedback is unclear. We show that inducing backward movement, an element of avoidance behaviour in Drosophila, engages negative valence signals in these animals, and reveal the neuronal mechanisms and adaptive significance of this effect. We develop a paradigm with odours as conditioned stimuli paired with optogenetically induced backward movement instead of a punishing unconditioned stimulus, and combined these experiments with pharmacology, high-resolution video tracking, functional imaging, connectome analyses, and modelling. Our results show that backward movement engages dopaminergic punishment neurons and supports aversive memories. Such avoidance-to-punishment feedback counterbalances extinction learning and maintains learned avoidance, reducing the risk of further punishment. This can explain the long-standing "avoidance paradox", the observation that avoidance adaptively persists even when it is successful and no punishment is received (Bolles 1972). Our results provide a neurobiologically grounded argument for an integrated view of behaviour organization and valence processing.


Conflict of interest statement

Declaration of interests The authors declare no competing interests.

Figures

Extended Data Fig. 1 |
Extended Data Fig. 1 |. Expression patterns of Gal4 drivers and MDN reconstruction.
a-c, Higher-resolution images of the anatomy panels in Fig. 1a (a) and Fig. 1j (b,c). Anti-GFP labelling (green) driven by MoonwalkerA (a) and MDN1A (c) is shown along with neuropil labelled by anti-Bruchpilot (magenta). Shown in (b) is the EM reconstruction of the MDN neurons (magenta) in the context of the neuropil (grey mesh). Genotypes: MoonwalkerA>ChrimsonA (a), MDNA>ChrimsonA (c).
Extended Data Fig. 2 |
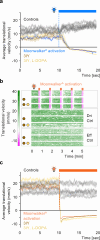
Extended Data Fig. 2 |. Optogenetically induced backward movement is unaffected by 3IY.
a, For the experiment shown in Fig. 1i, translational velocity (mm/s) was averaged across trials for each fly, for the 10 s before and during 10-s optogenetic activation (blue bar), and is plotted as mean ± SEM. For the experimental genotype (MoonwalkerA>ChR2XXLA, coloured traces), optogenetic activation leads to negative translational velocity, i.e. backward movement, regardless of the indicated drug treatment (brown: 3IY, light brown: additional supply of L-DOPA). In genetic controls (MoonwalkerA>+, +>ChR2XXLA) no backward movement is observed, likewise regardless of drug treatment (black traces) (N= 12,8,12,16,12,12,12,12,12). b, As in Fig. 1i, for Chrimson as the effector, showing that 3IY does not impact moonwalker-induced movement for an independent effector. Experimental genotype; MoonwalkerA>ChrimsonA; genetic controls: MoonwalkerA>+ (Dri Ctrl), +>ChrimsonA (Eff Ctrl) (N= 16,16,12,16,16,12,16,16,12). c, as in (a), for the experiment shown in (b).
Extended Data Fig. 3 |
Extended Data Fig. 3 |. Innate olfactory choice behaviour is unaffected by MDN silencing.
a,b, Overview (a) and outcome (b) of innate olfactory choice experiments. Clouds: odours. Light bulb: optogenetic silencing of MDNs. Odour choice in experimentally naïve flies does not differ for the experimental genotype (MDN1A>GtACR1) under control conditions without light stimulation (black) from the MDN1A-silenced condition (green), or from genetic controls under light stimulation (grey) (Dri Ctrl: MDN1A>+, Eff Ctrl: +>GtACR1) (N= 18,19,23,22). Box-whisker plots show median, interquartile range (box) and 10th/90th percentiles (whiskers). Data were analysed across groups by a Kruskal-Wallis test (ns: P> 0.05).
Extended Data Fig. 4 |
Extended Data Fig. 4 |. Characterization of lexA drivers.
a,b, Anti-GFP labelling (green) driven by MDN1B (a) and MoonwalkerB (b) along with neuropil labelled with anti-Bruchpilot (magenta). Other details as in the legend of Fig. 1a,j. c-e, Overview (c) and outcome of pairing odour with MDN1B activation using either ChR2XXL (blue: MDN1B>ChR2XXLB) (d), or Chrimson (orange: MDN1B>ChrimsonB) (e), resulting in aversive memory in the experimental genotypes but not in genetic controls (Dri Ctrl: MDN1B>+, Eff Ctrl: +>ChR2XXLB (d) or +>ChrimsonB (e)) (N= 12,12,10; 12,10,11). Box-whisker plots show median, interquartile range (box) and 10th/90th percentiles (whiskers). Data were analysed across groups by Kruskal-Wallis tests (P< 0.05), followed by pairwise comparisons (Mann-Whitney U-tests, *P< 0.05 with Bonferroni-Holm correction). Other details as in the legend of Fig. 1j.
Extended Data Fig. 5 |
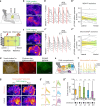
Extended Data Fig. 5 |. Compartmental topology of DAN engagement by MDN and moonwalker neuron activation.
a, Imaging plane and topology of the γ3 compartment (top) and its internal organization (Li et al. 2020) (bottom). Other KCs connect only to PAM12-dd or PAM12-md (not shown). b-b”, In vivo calcium imaging of flies expressing GCaMP across the DANs and optogenetic activation of MDNs by 200-ms red light stimulation, re-analysed from Fig. 3e to reveal within-γ3 topology (genotype: MDN1B>ChrimsonC; DANs>GCaMP). Shown in (b) are average intensity projections of a sample recording 2 s before/ after stimulation (Pre/ Post). For the γ3 compartment region of interest (stippled rectangle in b), calcium transients (ΔF/F0) for spatial bins from lateral (top) to medial (bottom) are displayed for consecutive activation trials (red vertical bars) (b’). Z-scored average calcium responses show stronger DAN engagement in lateral than medial bins (N = 8) (b”). c-c”, As in (b-b”), for 20-ms activation of the full set of moonwalker neurons (experimental genotype: MoonwalkerB>ChrimsonC; DANs>GCaMP), suggesting uniform DAN activation throughout γ3 (N= 6). d-g”, Analysis of the experiment in (c) for all imaged compartments. For a fly of the experimental genotype with the head capsule opened for imaging, panel (d) shows brightfield (left) and fluorescence microscopy images to confirm transgene expression (middle and right). Scale bar 100 μm. For the compartments covered at the chosen imaging plane (e), sample traces of raw calcium transients are shown for 5 trials of activation (red vertical lines) (f). Panel (g) as in (c), for the experimental genotype (top) and Controls (MoonwalkerB>+; DANs>GCaMP) (bottom). Calcium transients from the indicated compartments upon activation in the experimental genotype (coloured traces) and in Controls (grey traces) (g’). Activation of moonwalker neurons results in significant calcium responses (ΔΔF/F0) of DANs in only the γ2 compartment (N= 6,6) (g”). Box-whisker plots show median, interquartile range (box) and 10th/90th percentiles (whiskers). Calcium transients are plotted as mean ± SEM. Data were analysed by Friedman tests (*P< 0.05, ns: P> 0.05) (b”, c”) or by a Kruskal-Wallis test (P< 0.05), followed by pairwise comparisons (Mann-Whitney U-tests, *P< 0.05 with Bonferroni-Holm correction) (g”). (b”, c”, g’, g”) are based on the first optogenetic activation trial. Additional information in Extended Data Fig. 4b.
Extended Data Fig. 6 |
Extended Data Fig. 6 |. Activation of MDNs in explant preparations does not engage DANs.
a,b, Overview of imaging setup of explant brain (a) and brain-plus-VNC (b) preparation. MDN1B was activated using Chrimson with 200 ms or 1000 ms red light while calcium transients were monitored across the DANs of the horizontal lobe compartments by GCaMP6f. c, Average intensity projections from representative brain preparations of the experimental genotype (MDN1B>ChrimsonC; DANs>GCaMP) under two-photon illumination, with a focus on γ2– γ5 DANs (top) and γ1 and β’2 DANs (bottom). Dashed lines indicate compartment boundaries. d-e, Calcium transients (ΔF/F0) from 2 s before to 2 s after MDN1B activation with 200 ms of red light (red vertical bar) in brains of the experimental genotype (coloured traces; N= 10) or control brains (grey traces, N= 10) (MDN1B>+; DANs>GCaMP) (d). Calcium responses (ΔΔF/F0) in these brains comparing 2 s before activation to 2 s after activation (Δ long) or to 0.5 s after activation (Δ short). No significant differences between Chrimson-expressing and control brains were observed. f,g, As in (d-e), for brain-plus-VNC preparations (N= 10,10). h-k, As in (d-g), for 1000-ms red light, revealing a decrease in calcium responses in γ3 DANs of brain-plus-VNC preparations after 1000 ms stimulation and for the Δ short period, arguing for the functionality of the assay. Box-whisker plots show median, interquartile range (box) and 10th/90th percentiles (whiskers). Calcium transients are plotted as mean ± SEM. Data were analysed by Kruskal-Wallis tests (P< 0.05), followed by pairwise comparisons (Mann-Whitney U-tests, *P< 0.05 with Bonferroni-Holm correction).
Extended Data Fig. 7 |
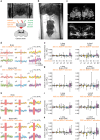
Extended Data Fig. 7 |. Temporal relationship of MDN-evoked leg movement and DAN engagement.
a, Sketch of the in vivo imaging setup. MDN1B was activated using Chrimson with 200-ms red light stimuli while calcium transients were monitored in horizontal lobe DANs. Animals were free to move their legs. Genotype: MDN1B>ChrimsonC; DANs>GCaMP. b, Average calcium signals (coloured traces) and leg movement (black traces) around the time of light stimulation (red vertical bar). Shown are z-scored values; leg movement refers to the motion energy calculated from the legs. c,d, Response reliability (c) and latency (d) of leg movements (grey) and DAN engagement (colour-coded by compartment) upon light stimulation. Responses are defined as values >2 standard deviations above the pre-2 s average within a 2 s time window after light stimulation. Reliability refers to the probability of responses across the five light stimulations; latency refers to the first time the response threshold is crossed after light stimulation. e,f, Pearson’s correlation of leg movement and engagement of the indicated DANs (e) and corresponding pairwise correlations (f). Panels show analyses of data from Fig. 3e and Fig. 4a–e (before trapping) for which reliable quantifications of leg movement were possible across all light stimulation trials (N= 11) (b,c, e,f) based on individual time data points (e,f); for the response latency measure in (d) sample sizes are naturally lower for the compartments in which no responses were observed (N= 11,11,10,11,6,6,9). Box-whisker plots show median, interquartile range (box) and 10th/90th percentiles (whiskers). Calcium signals are plotted as mean ± SEM.
Extended Data Fig. 8 |
Extended Data Fig. 8 |. No punishing effect of restraint or of MDN silencing.
a, Overview and outcome of olfactory learning experiments with movement restraint (Trapping; also see Fig. 4f, top) as reinforcer (genotype: CantonS, N= 13), suggesting that it has no punishing effect. Clouds: odours. Orange box: movement restraint. b, Overview and outcome of olfactory learning experiments with MDN silencing as reinforcer, suggesting that it has no punishing effect. Clouds: odours. Light bulb: optogenetic silencing of MDNs (MDN1A). Experimental genotype: MDN1A>GtACR1, Dri Ctrl: MDN1A>+, Eff Ctrl: +>GtACR1 (N= 12,12,12). Box-whisker plots show median, interquartile range (box) and 10th/90th percentiles (whiskers). Data were analysed with one-sample sign (OSS) (a) and Kruskal-Wallis tests (b) (ns: P> 0.05). Additional information in Supplemental Video 4.
Extended Data Fig. 9 |
Extended Data Fig. 9 |. Effects of varying model assumptions.
a, Mean learned odour values across 400 model flies, showing that the effect in Fig. 5d is consistent. Shaded regions show ± 2 standard deviations. b, A model fly analogous to the ones shown in Fig. 5a,b,f responding to a classical extinction task, with DANs intact or silenced during extinction. A model fly is exposed to odour and then shock during conditioning and learns the association value V (pink line). It is then exposed to odour without shock and extinguishes the association. Conditioning mainly induces depression in the approach compartment weights wap (orange line). Extinction effects are shared between compartments. c, As in (b), but with LTP at a slower rate, whereas LTD remains the same. This tweak to the model, which does not affect the qualitative results presented in Fig. 5, makes the dynamics of learning and extinction consistent with previous work (Felsenberg et al. 2018). Extinction occurs mainly via the ‘avoid’ compartment weights wav (purple line), and silencing reward DANs leads to loss of extinction (V), whereas silencing punishment DANs has a smaller effect on extinction (V). d-g, Model with MDN feedback that is not gated by value for odour 1 (d-e) or odour 2 (f,g) in two example model flies (d,f and e,g). In (e), the model fly spontaneously walks backwards in the presence of odour 1 and so learns an aversive association with it, missing out on the reward. In (f), the model fly learns an aversive association with odour 2 by repeatedly avoiding but without ever actually experiencing the negative reinforcement. This figure demonstrates the role of gating feedback by value. h, A model fly analogous to the one shown in Fig. 5d for the ‘No MDN feedback’ condition, for comparison with (i), which shows the model without subtractive normalization of the weights. This leads to weights continuing to decrease over time, eventually leading to negative synaptic weights. The learned values (V) are identical in (h,i) because the difference between the weights (w) remains the same.
Extended Data Fig. 10 |
Extended Data Fig. 10 |. Scenarios of how KC-MBON plasticity affects MDNs.
Schematic summary of Fig. 2c. Shown are scenarios of depressed (left) or potentiated (right) synapses between the KCs and the MBONs upstream of MDNs (KC-MBONLAL-MDN). Through pathways with sign-inversion (inhibitory MBON to excitatory LAL or vice versa) depressed/ potentiated KC-MBON synapses promote/ prevent MDN activity and avoidance. For MBONs that give rise to parallel pathways with excitatory and inhibitory effects on MDNs the scenario is different. Using synapse number as a proxy for connection strength, these have nearly equal influences on the MDNs (Fig. 2d). Through these MBONs, the MDNs receive both more excitation and more inhibition (originating in inhibitory MBONs when the KC-MBON synapses are depressed, but in excitatory MBONs when they are potentiated, whereas the respectively other MBONs in the indicated extreme case lose their influence on the MDNs). Terminals from LAL171,172 and LAL051 as the main conduits in these pathways are located in close proximity to one another on the MDN dendrites (Fig. 2e; Supplemental Data Synaptic Topology). Nonlinear dendritic interactions based on this proximity may thus render the MDNs particularly sensitive to modulation.
Fig. 1 |
Fig. 1 |. Moonwalker neuron activation engages a dopaminergic punishment signal.
a, Proposed action-valence relationship and expression of the transgenic driver to induce backward movement. MoonwalkerA>ChrimsonA; magenta: neuropil labelling (anti-Bruchpilot), green: moonwalker neuron labelling (anti-GFP). VNC: ventral nerve cord. b, Overview of learning experiments. Clouds: odours. Light bulb: optogenetic activation of all moonwalker neurons (MoonwalkerA) (c-i) or only the moonwalker descending neurons (MDN1A) (j). c, Aversive memory by pairing odour with moonwalker neuron activation (blue: MoonwalkerA>ChR2XXLA, grey: Driver control: MoonwalkerA>+, Effector control: +>ChR2XXLA, +) (N= 20,18,18). d, As in (c), for the indicated training-test intervals (N= 19,20,20,20,20,19). e, As in (c), using ChrimsonA as effector (orange: MoonwalkerA>ChrimsonA, grey: Driver control: MoonwalkerA>+, Effector control: +>ChrimsonA) (N= 17,17,18). f, As in (c), for a training procedure in which odour presentation followed moonwalker neuron activation (N= 18,15,15). g, Results for the experimental genotypes arranged according to the indicated intervals between odour and optogenetic activation (N= 23,23,23,18; 24; 24,24,24; 24) (includes data re-plotted from (c-h) for the-15 s and 120 s intervals). h, Inhibition of dopamine biosynthesis by 3-iodo-L-tyrosine (3IY), and its effects on learning from moonwalker activation (MoonwalkerA>ChR2XXLA, intervals −15 s or 120 s; blue: control, brown: 3IY, light brown: additional supply of 3,4-dihydroxy-L-phenylalanine (L-DOPA)) (N= 23,24,23; 20,19,20). DDC: dopamine decarboxylase. TH: tyrosine hydroxylase. i, Analysis of movement upon the treatments in (h). Shown is translational velocity (mm/s), colour-coded from magenta/backward to green/forward movement in relation to moonwalker activation (blue bars). Rows correspond to individual flies; the top three sets of rows show MoonwalkerA>ChR2XXLA flies; genetic controls, as in (c), are shown below (N= 12,8,12,16,12,12,12,12,12). j, EM reconstruction of the moonwalker descending neurons (MDNs, magenta) (grey mesh: brain and VNC) and expression of the transgenic driver covering them (MDN1A>ChrimsonA, details as in a). Learning experiments as in (c), showing aversive memory through MDN activation (blue: MDN1A>ChR2XXLA, grey: Driver control: MDN1A>+, Effector control: +>ChR2XXLA) (N= 21,17,17). Scale bars in (a,j): 50 μm. Stippled lines in (a,j) indicate stitching of images of brain and VNC from the same animal, processed separately. Box-whisker plots show median, interquartile range (box) and 10th/90th percentiles (whiskers). Data were analysed across groups by Kruskal-Wallis tests (P< 0.05), followed by pairwise comparisons (Mann-Whitney U-tests, *P< 0.05 with Bonferroni-Holm correction) (ns: P> 0.05). Higher-resolution versions of (a,j) in Extended Data Fig. 1. NeuronIDs for (j) in Methods Supplemental Table 2. Additional information in Extended Data Fig. 2.
Fig. 2 |
Fig. 2 |. MDNs are part of aversive memory output pathways.
a, EM reconstruction of a moonwalker descending neuron (MDN, magenta). VNC: ventral nerve cord. Yellow and black circles: post- and pre-synaptic sites, respectively. b, Heatmap of percent input for 2-step pathways reaching each MDN (rows) from each mushroom body output neuron type (MBONs, columns), determined from FlyWire-v783 after removing connections <10 synapses. Bracketed numbers refer to the number of neurons summed across hemispheres. c, Pathways from MBONs via neurons of the lateral accessory lobe (LALs) to the MDNs, combined for both hemispheres (omitting connections with <20 synapses total). Arrows are proportional to the total number of synapses (thinnest: 43 synapses, thickest: 2002 synapses). Horizontal bars show percent of input to the downstream partner, calculated as an average over the downstream neuron type, summed over the upstream neuron type. ACh: acetylcholine, orange. GABA: γ-aminobutyric acid, blue. Glu: glutamate, green. d, Percent of 2-step input to MDNs from each MBON type that passes through the indicated LAL. Percentages are calculated after averaging across MDNs. “Other” represents all other 2-step MBON-to-MDN pathways. e, Locations of synapses (dots) from the indicated LALs to the MDNs (magenta) colour-coded for transmitter as in (c). f, Overview and outcome of odour-shock learning experiments. Clouds: odours. Lightning bolt: electric shock. Light bulb: optogenetic silencing of MDNs. Relative to the Control condition with MDN signalling intact (black), silencing MDNs during the test reduced odour-shock memory scores (MDN1A silenced, green) (genotype in both cases: MDN1A>GtACR1) to levels less than in genetic controls (grey: Driver control: MDN1A>+, Effector control: +>GtACR1) (N= 13,22,21,21). g, As in (f), but for pairings of odours with sugar reward (orange cubes), showing that appetitive memory scores remained unaffected (N= 8,9,8,10). h, Role of MDNs in aversive memory output pathways and hypothesis of feedback to DANs. Box-whisker plots show median, interquartile range (box) and 10th/90th percentiles (whiskers). Data were analysed across groups by Kruskal-Wallis tests (P< 0.05) (ns: P> 0.05), followed by pairwise comparisons (Mann-Whitney U-tests, *P< 0.05 with Bonferroni-Holm correction). Higher-resolution versions of (a,e) and additional information in Supplemental Data Synapse Topology. NeuronIDs for (a-e) in Methods Supplemental Table 2. Additional information in Extended Data Fig. 3.
Fig. 3 |
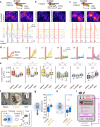
Fig. 3 |. Activation of MDNs favours activity in punishing DANs.
a,b, Combined optogenetics and in vivo imaging setup (a). Red light pulses of 200 ms were used to activate Chrimson-expressing MDNs, while calcium signals were measured in GCaMP6f-expressing mushroom body DANs (b; compartments colour-coded) using continuous two-photon excitation scanning. c,d, Average intensity projections of sample recordings 2 s before (Pre) and 2 s after the first MDN activation (Post) in flies expressing Chrimson in γ1 (c) or γ2 (d) DANs, and in Control flies not expressing Chrimson (grey); dashed lines indicate compartment boundaries (top panels). Calcium transients (ΔF/F0) upon optogenetic MDN activation (red vertical bars) in flies expressing Chrimson (coloured traces) and in Controls (grey traces) (middle panels). Activation of MDNs results in significant calcium responses (ΔΔF/F0) in DANs of the γ1 (c; N= 6 flies each) and γ2 compartments (d; N= 8,7 in Chrimson and Control flies) compared to those in Controls (bottom panels). Experimental genotypes: MDN1B>ChrimsonC; γ1>GCaMP (c) and MDN1B>ChrimsonC; γ2>GCaMP (d). Control genotypes: MDN1B>+; γ1>GCaMP (c) and MDN1B>+; γ2>GCaMP (d). e, Sample traces of raw calcium transients (ΔF/F0) across the DANs of the compartments colour-coded as in (b) upon MDN activation (red bars) (top panel). Panels below as in (c,d) but expressing GCaMP across the DANs, revealing strong responses in γ1– γ3 (N= 10,8 in Chrimson and Control flies). Experimental genotype: MDN1B>ChrimsonC; DANs>GCaMP. Control genotype: MDN1B>+; DANs>GCaMP. Box-whisker plots show median, interquartile range (box) and 10th/90th percentiles (whiskers). Except in the top panel in (e), calcium transients are plotted as mean ± SEM. Data were analysed by Mann-Whitney U-tests (*P< 0.05) (c,d) or by Kruskal-Wallis tests (P< 0.05), followed by pairwise comparisons (Mann-Whitney U-tests, *P< 0.05 with Bonferroni-Holm correction) (e). Quantification in the bottom panels in (c-e) is based on the first optogenetic activation. Additional information in Extended Data Fig. 4,5 and Supplemental Video 1,2.
Fig. 4 |
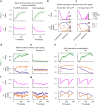
Fig. 4 |. Movement is required for DAN activation and punishment by MDNs.
a-c, Two-photon in vivo imaging before (a), while (b), and after (c) leg movement was restrained (Trapped) using a piece of cotton wool (top panels). 200 ms of red light stimulation was used to activate MDNs via Chrimson, while calcium signals were measured in the DANs of the indicated mushroom body compartments with GCaMP6f. Leg movements were calculated as the legs’ motion energy in videos captured by an infrared camera. Average intensity projections of the same field of view across conditions, from 2 s before (Pre) and 2 s after MDN activation (Post); dashed lines indicate compartment boundaries (middle panels). Sample traces of raw calcium transients (ΔF/F0) in the DANs of the indicated compartments and leg motion energy (bottom panels) with MDN activation indicated by red vertical bars. d, Calcium transients (mean ± SEM) in DANs of the indicated compartments upon the first MDN activation (red vertical bars) before (coloured lines), while (black lines, Trapped), and after (dotted lines) leg movement was restrained. e, MDN-evoked calcium responses (ΔΔF/F0) in DANs of the indicated compartments recorded across trapping conditions. Data points from individual flies are connected by lines (N= 10 flies). Genotype (a-e): MDN1B>ChrimsonC; DANs>GCaMP. f, Procedure for transiently restraining movement in the behavioural setup (top, Trapped) and overview of learning experiments (bottom). Clouds: odours. Light bulb: optogenetic activation of neurons indicated in (g, h). g,h, Pairing odour with optogenetic activation of MDNs establishes aversive memory under Control conditions but not when movement was restrained during the training period (g). No effect of such restraint was observed when activating the DANs of the γ1 compartment (h). Genotypes: MDN1A>ChR2XXLA (N= 29,29) (g) and γ1>ChR2XXLA (N= 24,24) (h). i, Schematic of reafferent feedback from learned avoidance to dopaminergic teaching signals. Box-whisker plots show median, interquartile range (box) and 10th/90th percentiles (whiskers). Data were analysed by Wilcoxon signed-rank tests with Bonferroni-Holm correction (e) or Mann-Whitney U-tests (g, h) (*P< 0.05) (ns: P> 0.05). Additional information in Extended Data Fig. 6–8 and Supplemental Video 3,4.
Fig. 5 |
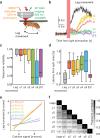
Fig. 5 |. MDN-mediated feedback counterbalances extinction learning.
a, Model schematic. Punishment and reward activate DANs with firing rates dp and dr, respectively. MBONs with firing rates map and mav promote approach and avoidance, respectively. KC-to-MBON weights (wap,wav) are depressed by co-activation of DANs and odour-responsive KCs. Approach or avoidance behaviour is determined probabilistically by the value (V) derived from MBON activity. Dice by Steaphan Greene, CC-BY-SA-3.0. b, Schematic of one-dimensional model environment. Reinforcement (punishment −1, reward 1) is received at either end. Different odours (green, magenta) activate different KCs. Arrowheads show possible action choices. c, Example trials of a single model fly navigating the arena. Trials end upon first reinforcement (left and right: reward, middle: punishment). Left and middle are before learning, right is after learning. d, Evolution of model parameters over multiple trials of the paradigm shown in (b). Circles denote ends of trials when the model fly received reward (top, odour 1) or punishment (bottom, odour 2). The value (V) of the rewarded odour 1 is learned through changes in KC-to-MBON weights (wap and wav, averaged across odour-responsive KCs) regardless of MDN feedback. Without MDN feedback, avoidance of the punished odour 2 is less persistent and the model fly receives a second punishment earlier (~timestep 200). e, Schematic of training, extinction protocols and test in the five experimental conditions. Clouds: odours. Grey circle: choice option without odour. Black and green light bulbs: conditions with or without MDN feedback. f, Results of simulations of protocols in (e). Without MDN feedback the full extent of extinction learning is revealed. Results averaged over 20 experiments per protocol, with 20 model flies per experiment. g, Mean learned odour value (V) during the protocols in (e, f). During acquisition (timesteps 1–36), 12 pulses of punishment (red bars) are delivered in the presence of odour. During the extinction protocol (after timestep 36), MDN feedback counterbalances the return of odour value to pre-training levels. Line thickness exceeds ±2 s.e. h, Behavioural experiment as in (e, f), using optogenetic silencing of the MDNs. Genotype: MDN1A>GtACR1 (N= 50,34,31,18,16). Box-whisker plots show median, interquartile range (box) and 10th/90th percentiles (whiskers). Data were analysed by Kruskal-Wallis tests (P< 0.05), followed by pairwise comparisons (Mann-Whitney U-tests, *P< 0.05 with Bonferroni-Holm correction). Additional information in Extended Data Fig. 8,9.

References

    1. Aso Y. et al. Specific dopaminergic neurons for the formation of labile aversive memory. Curr. Biol. 20, 1445–1451 (2010). - PMC - PubMed
    1. Aso Y. et al. Three dopamine pathways induce aversive odor memories with different stability. PLoS Genet. 8, e1002768 (2012). - PMC - PubMed
    1. Aso Y. et al. Mushroom body output neurons encode valence and guide memory-based action selection in Drosophila. eLife 3, e04580 (2014). - PMC - PubMed
    1. Azevedo A. et al. Connectomic reconstruction of a female Drosophila ventral nerve cord. Nature 631, 360–368 (2024). - PMC - PubMed
    1. Bidaye S. S., Machacek C., Wu Y. & Dickson B. J. Neuronal control of Drosophila walking direction. Science 344, 97–101 (2014). - PubMed

References Methods section

    1. Amin F. et al. Compromising tyrosine hydroxylase function extends and blunts the temporal profile of reinforcement by dopamine neurons in Drosophila. J. Neurosci. 45, e1498242024 (2025). - PMC - PubMed
    1. Barnstedt O. et al. Memory-relevant mushroom body output synapses are cholinergic. Neuron 89, 1237–1247 (2016). - PMC - PubMed
    1. Bidaye S.S. et al. Two brain pathways initiate distinct forward walking programs in Drosophila. Neuron 108, 469–485 (2020). - PMC - PubMed
    1. Buhmann J. et al. Automatic detection of synaptic partners in a whole-brain Drosophila electron microscopy data set. Nat. Methods 18, 771–774 (2021). - PMC - PubMed
    1. Eckstein N. et al. Neurotransmitter classification from electron microscopy images at synaptic sites in Drosophila melanogaster. Cell 187, 2574–2594 (2024). - PMC - PubMed

Publication types

LinkOut - more resources