. 2025 Jul 2:16:1466484.
doi: 10.3389/fgene.2025.1466484. eCollection 2025.

FAT1 mutation-related signature predicts survival risk and tumor immunogenicity in lung adenocarcinoma

Affiliations

FAT1 mutation-related signature predicts survival risk and tumor immunogenicity in lung adenocarcinoma

Lifeng Gao et al. Front Genet. .

Abstract

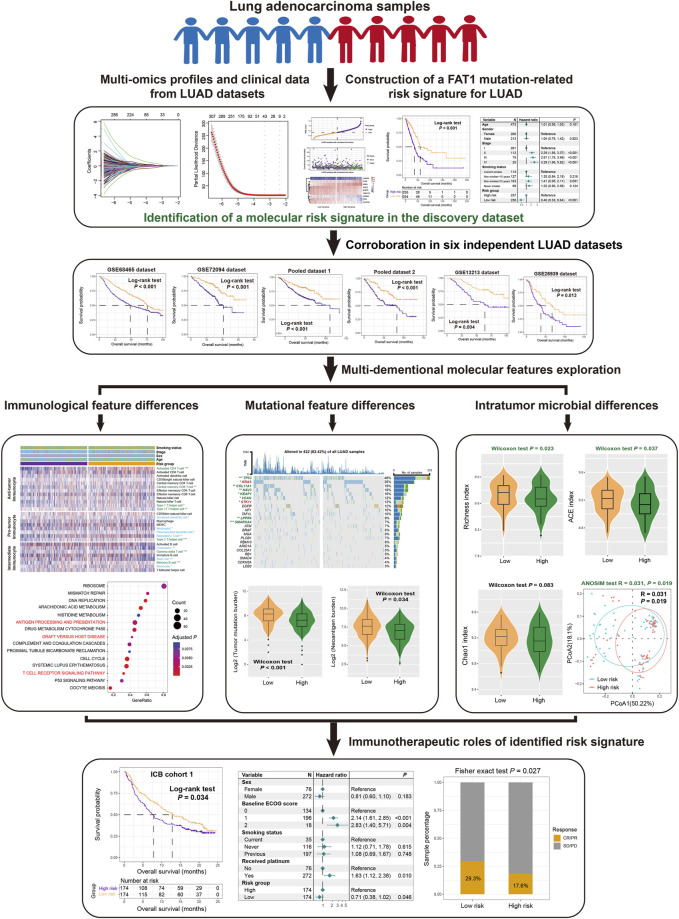
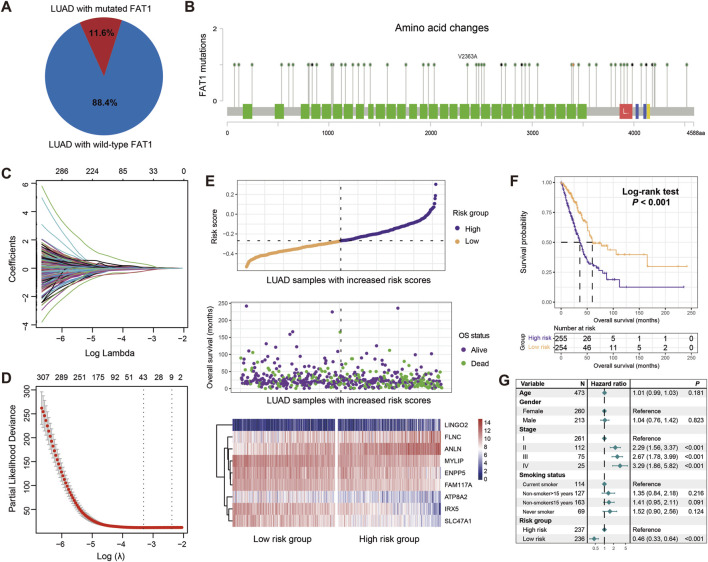
Background: FAT atypical cadherin 1 (FAT1) is a well-known tumor regulator that plays a crucial role in multiple cancer signaling pathways. Its mutations have been linked to tumor progression and immune regulation in various cancers, including lung adenocarcinoma (LUAD). In this study, we aim to identify a FAT1 mutation-related transcriptomic risk signature to assess the survival risks and immune status of LUAD patients.

Methods: A total of 2528 LUAD samples, which included both gene expression profiles and clinicopathologic data, were collected from 12 datasets. Additionally, two datasets treated with immunotherapies were also included to investigate the therapeutic effects.

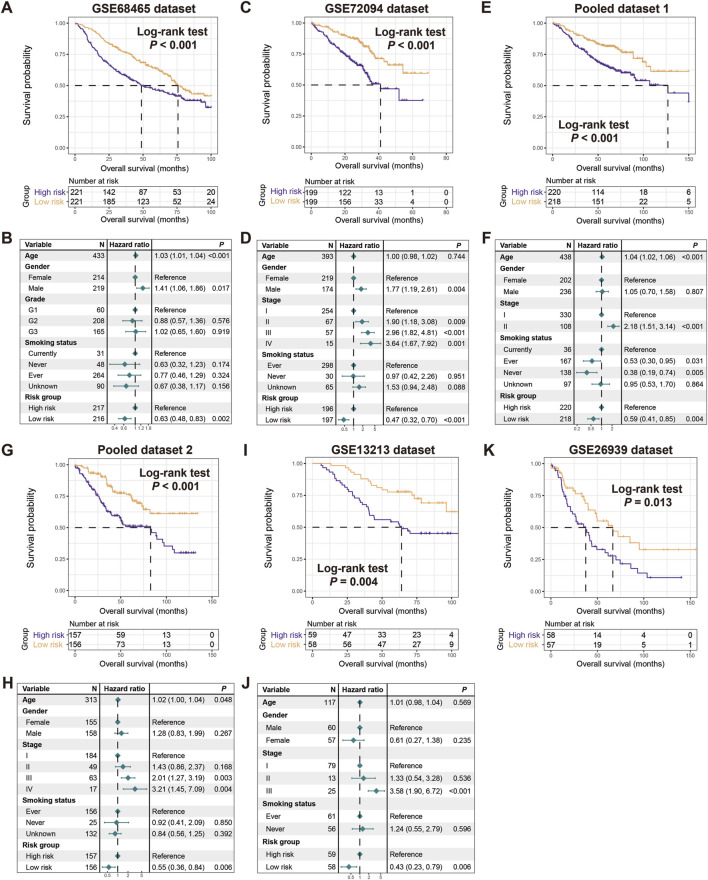
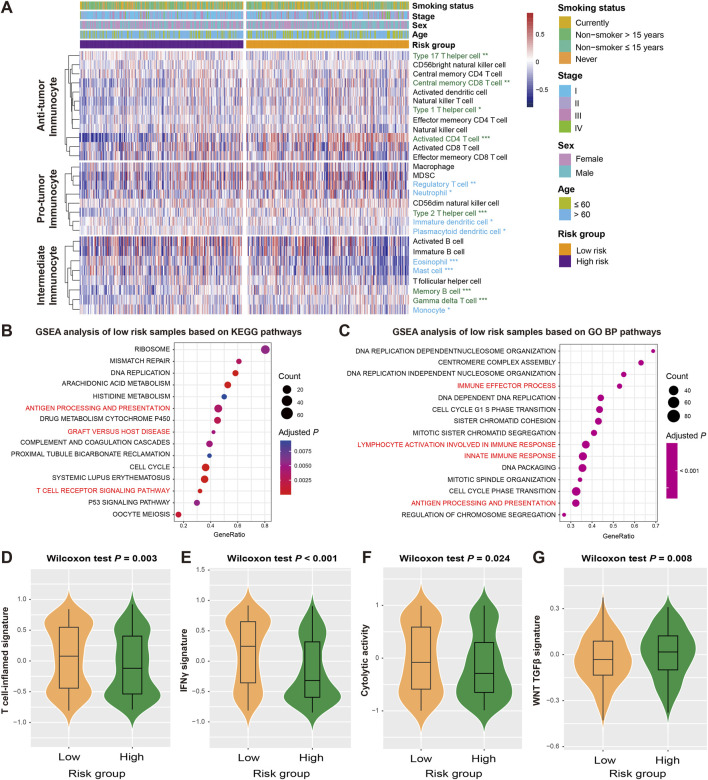
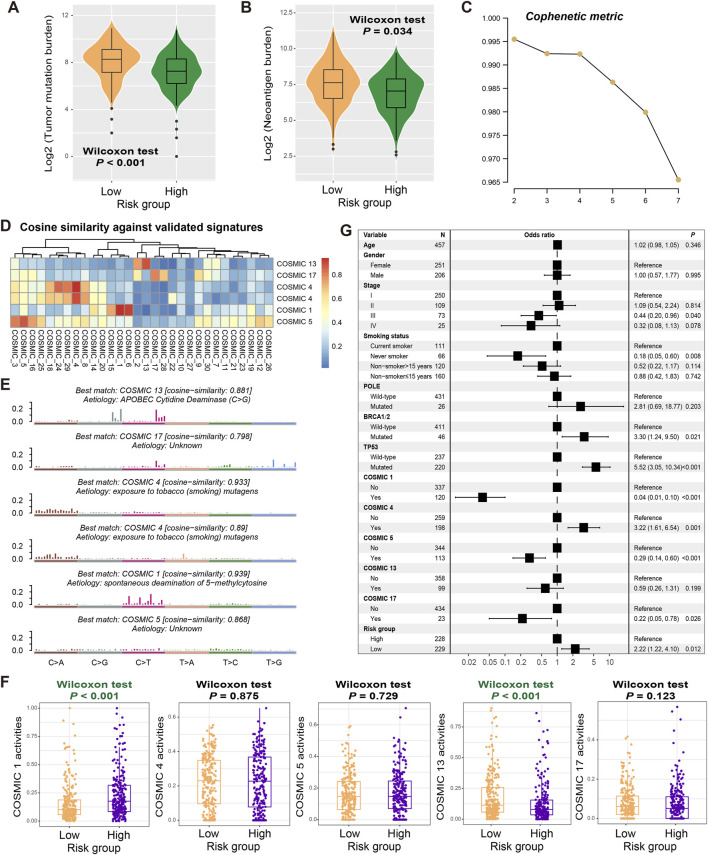
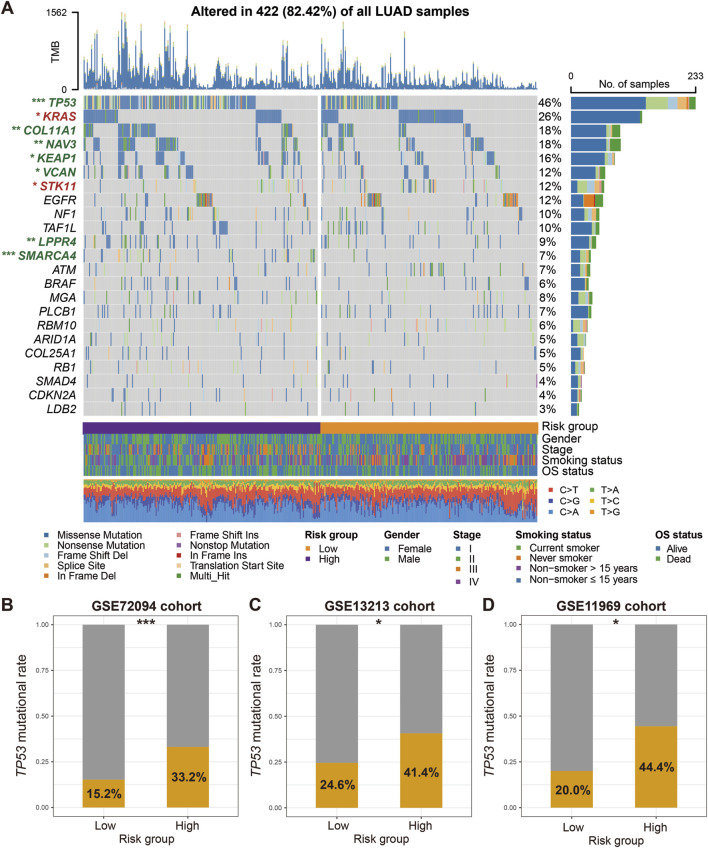
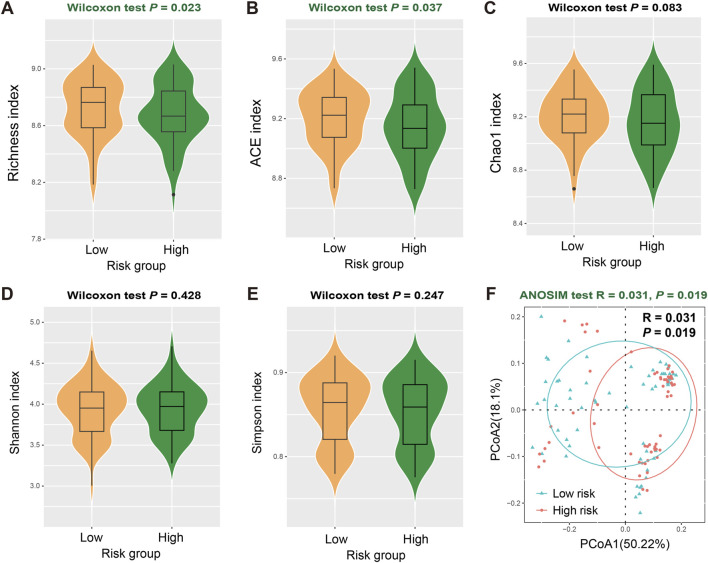
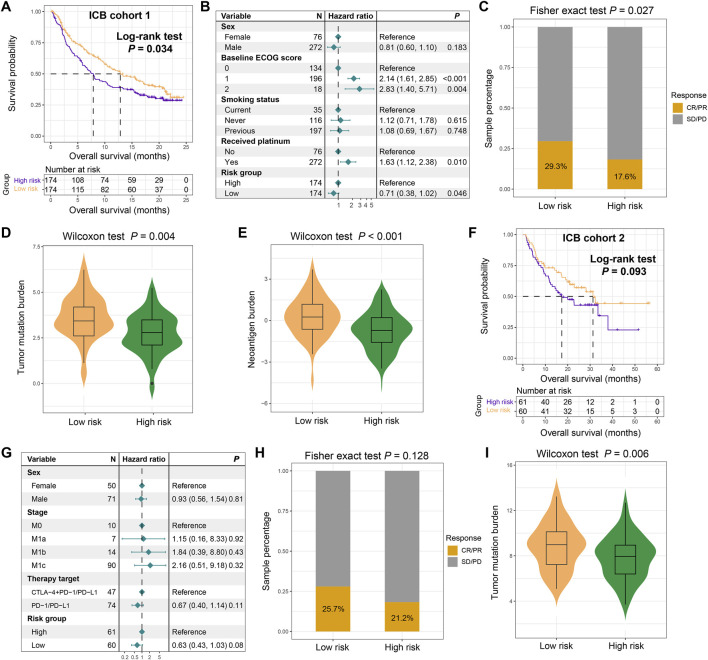
Results: We constructed a FAT1 mutation molecular signature based on 9 relevant genes. LUAD patients with low-risk scores demonstrated a more favorable prognosis compared to those with high-risk scores, which is corroborated by 6 additional independent datasets. Further immunological, mutational, and intratumor microbial analyses reveal that increased infiltration of immune effector cells, increased mutational burden, specific mutational signatures (such as age and APOBEC associated), mutations in driver genes (e.g., TP53, KEAP1, NAV3, and SMARCA4), and increased microbial α/β diversities are present in the low-risk LUAD patients. Based on the immunotherapeutic patients, an improved immune checkpoint blockade treatment prognosis and an elevated response rate are also observed in the low-risk signature group.

Conclusion: In summary, Our identified FAT1 mutation-related risk signature shows potential for assessing LUAD clinical outcomes, tumor immunogenicity, and immunotherapy effectiveness, providing valuable insights for LUAD clinical practice.

Keywords: FAT1 mutation signature; immune treatment; lung adenocarcinoma; prognostic indicators; survival risk; tumor immunogenicity.


Conflict of interest statement

The authors declare that the research was conducted in the absence of any commercial or financial relationships that could be construed as a potential conflict of interest.

Figures

FIGURE 1
FIGURE 1
The overall design of this study is to construct a risk signature related to FAT1 mutation in LUAD patients.
FIGURE 2
FIGURE 2
Construction of a risk signature associated with FAT1 mutations in LUAD based on the discovery dataset. (A) Proportion of FAT1 mutation and wild-type LUAD patients in the discovery dataset. (B) Changes in all amino acids resulting from FAT1 mutations. Green blocks represent amino acid changes induced by FAT1 missense mutations, blue blocks represent frame shift mutations, red blocks represent nonsense mutations, and yellow blocks represent splice site mutations. (C) Lasso regression profiles of associations of lambda and coefficients. (D) Variation in partial likelihood deviance (PLD) with respect to log lambda changes. The red dots indicate the detailed partial likelihood of deviance values, the gray lines indicate the standard error (SE), the two vertical dotted lines on the left and right indicate the optimal gene combination with 1-SE criteria and minimum criteria, separately. (E) Distribution of risk scores in LUAD samples and their association with survival. Differential expression of nine FAT1 mutation-related genes in high-risk and low-risk subgroups. (F) Kaplan-Meier survival curves stratified by high- and low-risk populations. (G) Multivariate Cox regression model incorporating age, gender, clinical stage, and smoking status to obtain the real association between risk signature and LUAD prognosis.
FIGURE 3
FIGURE 3
Validation of the constructed risk signature. Kaplan-Meier survival curves divided with low- and high-risk LUAD patients in (A) GSE68465, (C) GSE72094, (E) pooled dataset 1, (G) pooled dataset 2, (I) GSE13213, and (K) GSE26939. Multivariate Cox regression models of the associations between FAT1 mutation risk signature and LUAD prognosis were performed in (B) GSE68465, (D) GSE72094, (F) pooled dataset 1, (H) pooled dataset 2, and (J) GSE13213.
FIGURE 4
FIGURE 4
Association of the FAT1 mutation risk signature with immunocyte infiltration and tumor immunogenicity. (A) Infiltration proportion of distinct immunocytes in low-versus high-risk LUAD subgroups. Immunocytes highlighted with green represent its infiltration was enhanced in low-risk patients, whereas the blue represent the infiltration was decreased in low-risk patients. GSEA analyses of low-risk patients were performed based on (B) KEGG and (C) GO BP databases. Pathways highlighted with red are immune response-related. Distinct enrichment scores of (D) T cell-inflamed signature, (E) IFNγ signature, (F) cytolytic activity signature, and (G) WNT TGF-β signature in low- and high-risk LUAD subgroups.
FIGURE 5
FIGURE 5
Mutational features associated with the constructed risk signature. Associations of the determined FAT1 mutation risk signature with (A) TMB and (B) NB. (C) Associations of the cophenetic metric with extracted LUAD mutational signature numbers. (D) The detected six mutational signatures versus well-known COSMIC signatures using the cosine similarity. (E) Detailed mutational features of the detected six mutational signatures. (F) Distinct mutational activities of five signatures between low- and high-risk patients. (G) Multivariate Logistic regression was conducted with age, sex, stage, smoking status, detected mutational signatures, and DNA repair gene mutations taken into account to acquire the connection between FAT1 mutation risk signature and TMB.
FIGURE 6
FIGURE 6
Identification of LUAD SMGs and their distinct mutation frequencies in two risk subgroups. (A) Waterfall plot representation of 23 SMGs determined from LUAD somatic mutational data in low-versus high-risk patients. SMGs highlighted with green exhibit the significantly decreased mutation frequencies in the low-risk group, whereas SMGs highlighted with red exhibit the increased mutation frequencies in the low-risk group. Validation of the association of TP53 mutation frequencies with two risk groups in (B) GSE72094, (C) GSE13213, and (D) GSE11969 datasets. *P < 0.05, **P < 0.01, ***P < 0.001.
FIGURE 7
FIGURE 7
Association of FAT1 mutation risk signature with intratumor microbial diversities. Distinct intratumor microbial α diversity indexes including (A) Richness, (B) ACE, (C) Chao1, (D) Shannon, and (E) Simpson index in low- and high-risk LUAD patients. (F) Distinct β diversity between two risk subgroups evaluated with the ANOSIM test.
FIGURE 8
FIGURE 8
The constructed FAT1 mutation risk signature for assessing immunotherapeutic response. (A) Immunotherapeutic survival curves for low- and high-risk patients in the ICB cohort 1. (B) Multivariable Cox regression analysis showing the association between the FAT1 mutation risk signature and immunotherapeutic survival, adjusted for clinical covariates. (C) Distinct immunotherapeutic response rates in two risk subpopulations. (D) TMB and (E) NB levels in low- and high-risk subgroups in the ICB cohort 1. (F) Immunotherapeutic survival curves for low- and high-risk patients in the ICB cohort 2. (G) Multivariable Cox regression analysis showing the association between the FAT1 mutation risk signature and immunotherapeutic survival, adjusted for clinical covariates in the ICB cohort 2. (H) Distinct immunotherapeutic response rates in two risk subpopulations in the ICB cohort 2. (I) TMB levels in low- and high-risk subgroups in the ICB cohort 2.

Similar articles

References

    1. Alexandrov L. B., Nik-Zainal S., Wedge D. C., Aparicio S. A. J. R., Behjati S., Biankin A. V., et al. (2013). Signatures of mutational processes in human cancer. Nature 500 (7463), 415–421. 10.1038/nature12477 - DOI - PMC - PubMed
    1. Amaro A., Esposito A. I., Gallina A., Nees M., Angelini G., Albini A., et al. (2014). Validation of proposed prostate cancer biomarkers with gene expression data: a long road to travel. Cancer Metastasis Rev. 33 (2-3), 657–671. 10.1007/s10555-013-9470-4 - DOI - PMC - PubMed
    1. Andrews L. P., Butler S. C., Cui J., Cillo A. R., Cardello C., Liu C., et al. (2024). LAG-3 and PD-1 synergize on CD8(+) T cells to drive T cell exhaustion and hinder autocrine IFN-gamma-dependent anti-tumor immunity. Cell 187 (16), 4355–4372.e22. 10.1016/j.cell.2024.07.016 - DOI - PMC - PubMed
    1. Ayers M., Lunceford J., Nebozhyn M., Murphy E., Loboda A., Kaufman D. R., et al. (2017). IFN-gamma-related mRNA profile predicts clinical response to PD-1 blockade. J. Clin. investigation 127 (8), 2930–2940. 10.1172/JCI91190 - DOI - PMC - PubMed
    1. Batlle E., Massague J. (2019). Transforming growth factor-beta signaling in immunity and cancer. Immunity 50 (4), 924–940. 10.1016/j.immuni.2019.03.024 - DOI - PMC - PubMed

LinkOut - more resources