

Association between insulin resistance-related lipid indices and arthritis: a U. S. cross-sectional study
- PMID: 40672425
- PMCID: PMC12263402
- DOI: 10.3389/fnut.2025.1583598
Association between insulin resistance-related lipid indices and arthritis: a U. S. cross-sectional study
Abstract
Objectives: Arthritis is a degenerative disease that causes a huge social burden. Lipid-related molecules participate in the inflammatory response process of arthritis and are closely related to the pathological process of arthritis. Lipid-related indicators are easily available and have great potential in predicting arthritis. This study used cross-sectional data to explore lipid-related indicators and arthritis risk.
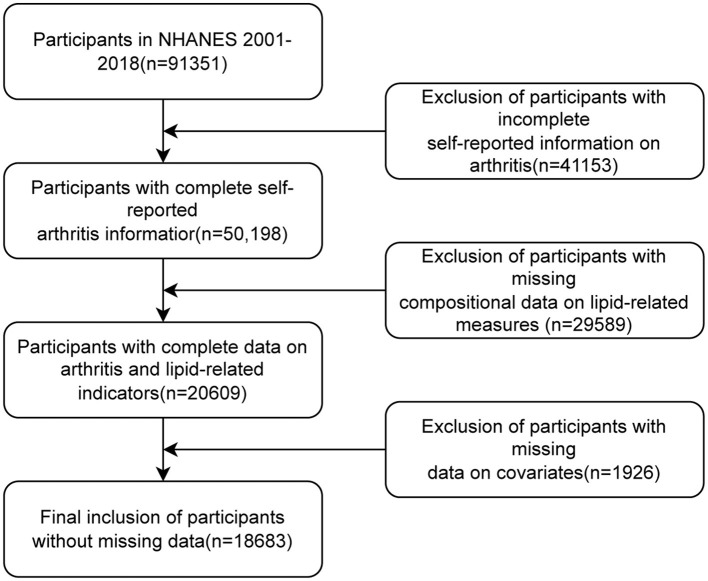
Methods: 18,683 participants were involved in this study, selected from the NHANES database covering the period from 2001 to 2018. The study utilized multivariate regression models to examine the association between various lipid-related parameters (including the TyG index, TyG-WC index, TyG-WHtR index, TyG-BMI index, HOMA-IR index, VAI index, and LAP index) and arthritis.
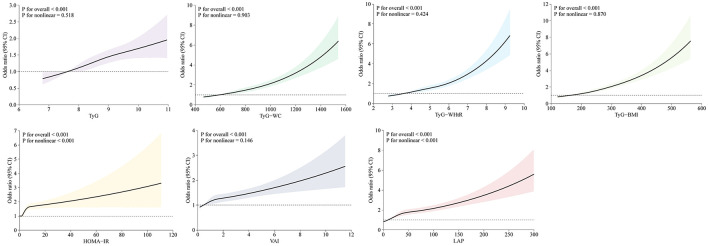
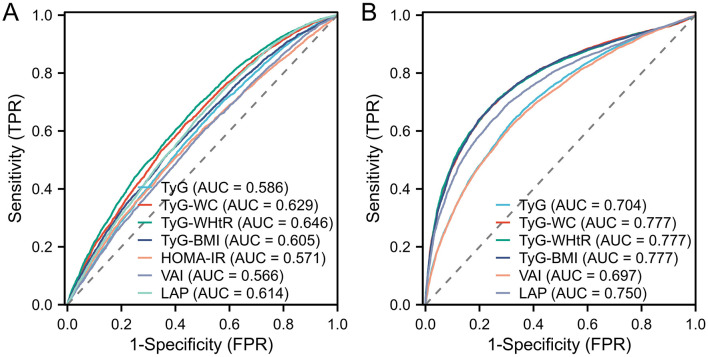
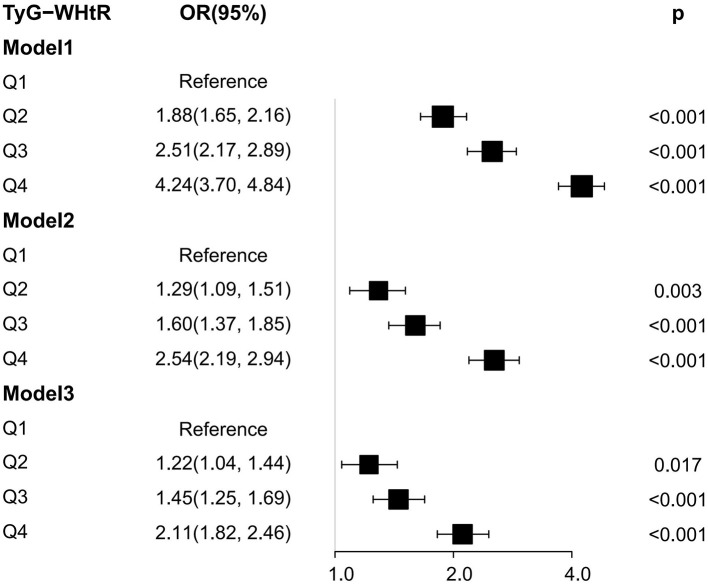
Results: After taking into account and appropriately addressing potential confounding variables and factors, all seven lipid-related indicators were positively associated with arthritis risk, and there was a significant difference in the highest quartile of seven lipid-related indicators compared with the lowest quartile (P < 0.001). Among them, the area under the ROC curve (AUC) of TyG-WC, TyG-WHtR, TyG-BMI, and LAP was >0.6, indicating they had modest accuracy in predicting arthritis. Logistic regression analysis showed that the best Cut-off values for predicting arthritis for these indicators were as follows: TyG: 8.45 [Odds ratio (95% Cl) = 1.77 (1.62, 1.94)]; TyG-WC: 850.39 [Odds ratio (95% Cl) = 1.36 (1.24, 1.49)]; TyG-WHtR: 4.97 [Odds ratio (95% Cl) = 2.39 (2.17, 2.63)]; TyG-BMI: 255.24 [Odds ratio (95% Cl) = 1.87 (1.71, 2.05)]; HOMA-IR: 2.79 [Odds ratio (95% Cl) = 1.51 (1.39, 1.65)]; VAI: 1.35 [Odds ratio (95% Cl) = 1.60 (1.47, 1.75)]; LAP: 33.46 [Odds ratio (95% Cl) = 1.20 (1.09, 1.31)], both P-values are < 0.001.
Conclusions: The results showed that seven lipid-related markers were positively associated with arthritis risk. Enhancing the management of glucose, lipids, and insulin sensitivity may significantly reduce the risk of arthritis.
Keywords: NHANES; TyG; arthritis; cross-sectional study; insulin resistance.
Copyright © 2025 Wu, Teng, Wang, Shi, Gao, Xu and Yue.
Conflict of interest statement
The authors declare that the research was conducted in the absence of any commercial or financial relationships that could be construed as a potential conflict of interest.
Figures
Similar articles
-
Potential of seven insulin resistance indicators as biomarkers to predict infertility risk in U.S. women of reproductive age: a cross-sectional study.Reprod Biol Endocrinol. 2025 May 24;23(1):77. doi: 10.1186/s12958-025-01416-w. Reprod Biol Endocrinol. 2025. PMID: 40413481 Free PMC article.
-
Association between various insulin resistance surrogates and gallstone disease based on national health and nutrition examination survey.Sci Rep. 2025 Jul 16;15(1):25877. doi: 10.1038/s41598-025-09482-1. Sci Rep. 2025. PMID: 40670519 Free PMC article.
-
The association of obesity and lipid-related indicators with all-cause and cardiovascular mortality risks in patients with diabetes or prediabetes: a cross-sectional study based on machine learning algorithms.Front Endocrinol (Lausanne). 2025 Jun 2;16:1492082. doi: 10.3389/fendo.2025.1492082. eCollection 2025. Front Endocrinol (Lausanne). 2025. PMID: 40529828 Free PMC article.
-
Systemic pharmacological treatments for chronic plaque psoriasis: a network meta-analysis.Cochrane Database Syst Rev. 2017 Dec 22;12(12):CD011535. doi: 10.1002/14651858.CD011535.pub2. Cochrane Database Syst Rev. 2017. Update in: Cochrane Database Syst Rev. 2020 Jan 9;1:CD011535. doi: 10.1002/14651858.CD011535.pub3. PMID: 29271481 Free PMC article. Updated.
-
Systemic pharmacological treatments for chronic plaque psoriasis: a network meta-analysis.Cochrane Database Syst Rev. 2021 Apr 19;4(4):CD011535. doi: 10.1002/14651858.CD011535.pub4. Cochrane Database Syst Rev. 2021. Update in: Cochrane Database Syst Rev. 2022 May 23;5:CD011535. doi: 10.1002/14651858.CD011535.pub5. PMID: 33871055 Free PMC article. Updated.
References
-
- Contreras-Hernández IF, Vargas-De-León C, García-Cortes LR, Flores-Miranda A, Romero-Nava R, Ocharán-Hernández ME. Comparison of ten surrogate insulin resistance and obesity markers to identify metabolic syndrome in Mexican adults. Metabolites. (2024) 14:358. 10.3390/metabo14070358 - DOI - PMC - PubMed
LinkOut - more resources
Full Text Sources
Research Materials