. 2025 Jul 16;7(4):fcaf222.
doi: 10.1093/braincomms/fcaf222. eCollection 2025.

The lifetime accumulation of multimorbidity and its influence on dementia risk: a UK Biobank study

Affiliations

The lifetime accumulation of multimorbidity and its influence on dementia risk: a UK Biobank study

Raihaan Patel et al. Brain Commun. .

Abstract

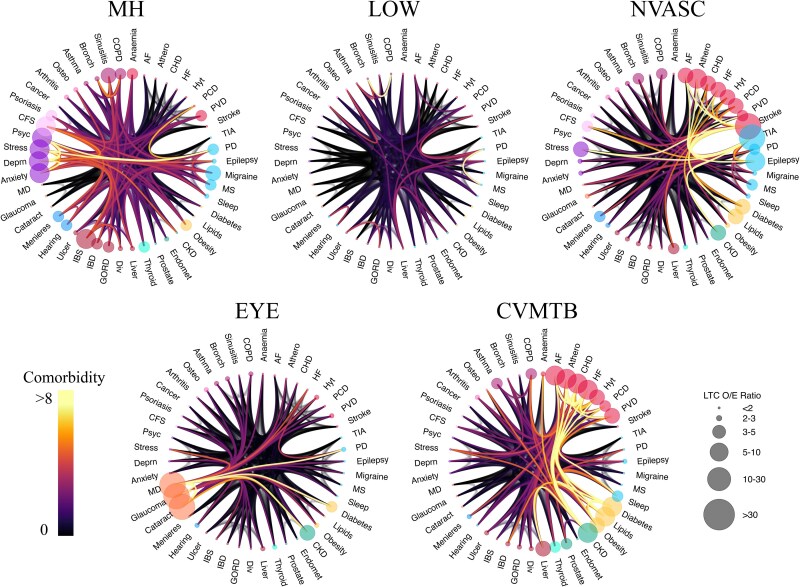
The number of people living with dementia worldwide is projected to reach 150 million by 2050, making prevention a crucial priority for health services. The co-occurrence of two or more chronic health conditions, termed multimorbidity, occurs in up to 80% of dementia patients, making multimorbidity an important risk factor for dementia. However, we lack an understanding of the specific health conditions, and their age of onset, that drive the link between multimorbidity and dementia. Using data from 282 712 participants of the UK Biobank, we defined the sequential patterns of accumulation of 46 chronic conditions over the life course. By grouping individuals based on their life history of chronic illness, we show here that the risk of incident dementia can be stratified by both the type and timing of their accumulated chronic conditions. We identified several distinct clusters of multimorbidity throughout the lifespan (cardiometabolic, mental health, neurovascular, peripheral vascular, eye diseases and low/no multimorbidity). We observed that the odds of developing dementia varied based on when these comorbidities were diagnosed. Until midlife (age 55), the accumulation of cardiometabolic conditions, such as coronary heart disease, atrial fibrillation, and diabetes, was most strongly associated with dementia risk. However, from 55 to 70 years, the accumulation of mental health conditions, such as anxiety and depression, as well as neurovascular conditions, such as stroke and transient ischaemic attack, was associated with an over 2-fold increase in dementia risk compared with low multimorbidity. Importantly, individuals who continuously and sequentially accumulate cardiometabolic, mental health, and neurovascular conditions were at greatest risk. The age-dependent role of multimorbidity in predicting dementia risk could be used for early stratification of individuals into high- and low-risk groups and could inform targeted prevention strategies based on a person's prior history of chronic disease.

Keywords: cluster analysis; dementia; multimorbidity; risk stratification.


Conflict of interest statement

The authors report no competing interests.

Figures

Graphical Abstract
Graphical Abstract
Figure 1
Figure 1
Tracking lifetime accumulation of multimorbidity. Study overview showing the derivation of lifetime multimorbidity patterns for two sample subjects. (A) For each participant, we ascertain the diagnosis of a variety of chronic conditions using linked electronic health records. Based on the age of onset, diagnoses are considered in only one of three distinct age bands: 0–55, 55–65, and 65–70 years, representing early, mid, and late life. (B) Within each age band, a clustering analysis is performed. At age 55, participants are clustered into groups based on their conditions diagnosed from birth to age 55. At age 65, participants are clustered based on their conditions diagnosed between ages 55 and 65. At age 70, participants are clustered based on their conditions diagnosed between ages 65 and 70. (C) We track the movement of participants between clusters across the different age bands. Participants may move between clusters describing different multimorbidity patterns (e.g. gastrointestinal → respiratory) or may move between clusters defined by similar conditions (e.g. cardiovascular → cardiovascular), depending on their unique pattern of accumulated conditions.
Figure 2
Figure 2
Multimorbidity patterns from birth to age 55 are defined by mental health, cardiometabolic, neurovascular, eye and low disease burden patterns. For each multimorbidity cluster identified from age 0 to 55 years (N = 282 712; k = 5), we plot a chord diagram describing the defining conditions and their comorbidity patterns. Each condition is represented by a dot along the circumference of the cluster diagram. The dots are colour coded according to ICD-10 classification (e.g. starting with anaemia and moving clockwise, cardiovascular conditions are in red; neurological conditions are in light blue; metabolic conditions are in yellow; genitourinary conditions are in teal; thyroid conditions are in light teal; gastrointestinal conditions are in burgundy; sensory (hearing) conditions are in blue; sensory (eye) conditions are in orange; mental health conditions are in purple; chronic fatigue syndrome, psoriasis, and cancer are in light pink (grouped together as ‘other’ conditions); musculoskeletal conditions are in pink and respiratory conditions are in dark pink]. The size of the dot is scaled to match the OE ratio, such that a larger OE represents a larger than expected proportion of participants in the cluster having a diagnosis of a given chronic condition. Lines connecting pairs of conditions are colour coded to represent the strength of comorbidity between two given conditions, such that orange–yellow lines represent strong comorbidity, while black lines indicate low comorbidity. The clusters are named according to the OE and comorbidity patterns. Moving clockwise from top left, the multimorbidity clusters from birth to age 55 are MH, LOW, NVASC, CVMTB and EYE clusters. AF, atrial fibrillation; Athero, atherosclerosis; HF, heart failure; Hyt, hypertension; PCD, pulmonary circulation disorder; PVD, peripheral vascular disease; PD, Parkinson’s disease; MS, multiple sclerosis; CKD, chronic kidney disorder; Endomet, endometriosis; Div, diverticular disease; GORD, gastro-oesophageal reflux disease; IBD, inflammatory bowel disease; IBS, irritable bowel syndrome; MD, macular degeneration; Deprn, depression; Psyc, psychotic disorders; CFS, chronic fatigue syndrome; Osteo, osteoporosis; Bronch, bronchiectasis; COPD, chronic obstructive pulmonary disease.
Figure 3
Figure 3
Multimorbidity patterns from age 55 to 65 are defined by mental health, cardiometabolic, neurovascular, peripheral vascular and low disease burden patterns. Figure 3 plots, for each multimorbidity cluster identified from age 55 to 65 years (N = 282 712; k = 5), a chord diagram describing the defining conditions and their comorbidity patterns. Moving clockwise from top left, the multimorbidity clusters from age 55 to 65 are MH, LOW, NVASC, CVMTB and PVASC clusters. AF, atrial fibrillation; Athero, atherosclerosis; HF, heart failure; Hyt, hypertension; PCD, pulmonary circulation disorder; PVD, peripheral vascular disease; PD, Parkinson’s disease; MS, multiple sclerosis; CKD, chronic kidney disorder; Endomet, endometriosis; Div, diverticular disease; GORD, gastro-oesophageal reflux disease; IBD, inflammatory bowel disease; IBS, irritable bowel syndrome; MD, macular degeneration; Deprn, depression; Psyc, psychotic disorders; CFS, chronic fatigue syndrome; Osteo, osteoporosis; Bronch, bronchiectasis; COPD, chronic obstructive pulmonary disease.
Figure 4
Figure 4
Multimorbidity patterns from age 65 to 70 are defined by mental health, cardiometabolic, neurovascular, peripheral vascular and low disease burden patterns. Figure 4 plots, for each multimorbidity cluster identified from age 65 to 70 years (N = 216 372; k = 5), a chord diagram describing the defining conditions and their comorbidity patterns. Moving clockwise from top left, the multimorbidity clusters from age 65 to 70 are MH, LOW, NVASC, CVMTB, and PVASC clusters. AF, atrial fibrillation; Athero, atherosclerosis; HF, heart failure; Hyt, hypertension; PCD, pulmonary circulation disorder; PVD, peripheral vascular disease; PD, Parkinson’s disease; MS, multiple sclerosis; CKD, chronic kidney disorder; Endomet, endometriosis; Div, diverticular disease; GORD, gastro-oesophageal reflux disease; IBD, inflammatory bowel disease; IBS, irritable bowel syndrome; MD, macular degeneration; Deprn, depression; Psyc, psychotic disorders; CFS, chronic fatigue syndrome; Osteo, osteoporosis; Bronch, bronchiectasis; COPD, chronic obstructive pulmonary disease.
Figure 5
Figure 5
Multimorbidity trajectories of dementia patients. Our clustering analysis separates participants into multimorbidity groups in each of three age bands (N = 282 712 for 0–55 and 55–65 years; N = 216 372 for 65–70 years). Here, a Sankey diagram is used to visualize the movement of dementia patients between multimorbidity clusters from 55 to 65 years and from 65 to 70 years (similar clusters are displayed on the same row for ease of interpretation, although the clustering procedure was run independently for each age band). Parameters of the figure (block height, link width, link colour) are coordinated to highlight the multimorbidity trajectories that have a larger proportion of participants who received a future diagnosis of dementia. The height of each block is scaled to the log of the total number of future dementia cases in a given cluster (taller blocks represent larger numbers of future patients). Similarly, the height of each link is scaled to the log of the total number of future dementia cases who follow a given trajectory. To highlight the trajectories which occur more frequently in future dementia patients, the colour of the links is scaled to the proportion of participants in the full sample following a trajectory who receive a future diagnosis of dementia. For example, the wide link between the LOW clusters at 55 and 65 years indicate a relatively larger number of participants in the full sample following this trajectory who receive a future diagnosis. However, the dark purple colour of this link conveys that a relatively lower percentage (2.38%) of individuals in the full sample following this trajectory receive a future diagnosis of dementia. Conversely, the bright link between CVMTB at 65 years and NVASC at 70 years indicates a higher percentage (8.13%) of participants in the full sample following this trajectory receive a future diagnosis of dementia, though the overall number of individuals following this path is not as large as the LOW at 55 years to LOW at 65 years path.

References

    1. Winblad B, Amouyel P, Andrieu S, et al. Defeating Alzheimer’s disease and other dementias: A priority for European science and society. Lancet Neurol. 2016;15(5):455–532. - PubMed
    1. Poblador-Plou B, Calderón-Larrañaga A, Marta-Moreno J, et al. Comorbidity of dementia: A cross-sectional study of primary care older patients. BMC Psychiatry. 2014;14(1):84. - PMC - PubMed
    1. van Oostrom SH, Picavet HSJ, de Bruin SR, et al. Multimorbidity of chronic diseases and health care utilization in general practice. BMC Fam Pract. 2014;15:61. - PMC - PubMed
    1. Palladino R, Tayu Lee J, Ashworth M, Triassi M, Millett C. Associations between multimorbidity, healthcare utilisation and health status: Evidence from 16 European countries. Age Ageing. 2016;45(3):431–435. - PMC - PubMed
    1. Calderón-Larrañaga A, Vetrano DL, Ferrucci L, et al. Multimorbidity and functional impairment-bidirectional interplay, synergistic effects and common pathways. J Intern Med. 2019;285(3):255–271. - PMC - PubMed

LinkOut - more resources