

Hs-CRP/HDL-C ratio as a predictive inflammatory-lipid marker for sarcopenia: evidence from NHANES 2015-2018
- PMID: 40672942
- PMCID: PMC12264492
- DOI: 10.3389/fimmu.2025.1600421
Hs-CRP/HDL-C ratio as a predictive inflammatory-lipid marker for sarcopenia: evidence from NHANES 2015-2018
Abstract
Objective: This study aimed to investigate the association between the high-sensitivity C-reactive protein/high-density lipoprotein cholesterol (Hs-CRP/HDL-C) ratio and sarcopenia among U.S. population by using composite marker integrating systemic inflammation and lipid metabolism.
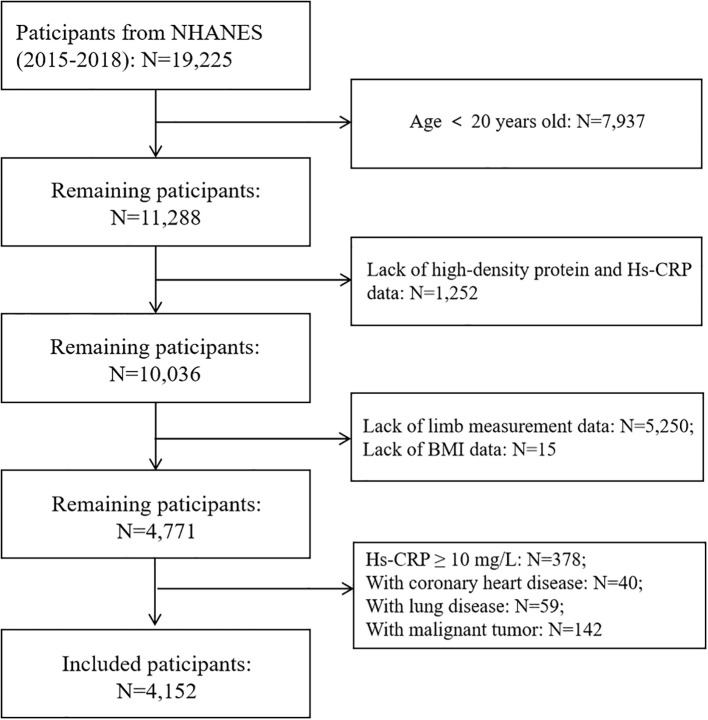
Method: This study included participants from the 2015-2018 of the National Health and Nutrition Examination Survey (NHANES). Sarcopenia was diagnosed based on the skeletal muscle index (SMI) by using dual-energy X-ray absorptiometry (DXA) technology. The Hs-CRP/HDL-C ratio was derived from laboratory examinations, was categorized into quartiles. Multivariate logistic regression models, adjusted for demographic and clinical covariates, were employed to assess the association between the Hs-CRP/HDL-C ratio and sarcopenia. Subgroup analysis and restricted cubic splines (RCS) were used to examine potential nonlinear relationships and threshold effects. Receiver operating characteristic (ROC) curve was used to evaluate the performance of the Hs-CRP/HDL-C ratio, Hs-CRP, and HDL-C indicators in predicting sarcopenia.
Results: This study finally recorded 4,152 participants from NHANES from 2015-2018 for analysis. Elevated Hs-CRP/HDL-C ratios were significantly associated with an increased risk of sarcopenia, with a dose-response relationship observed across quartiles (p for trend <0.05). The fully adjusted model revealed that each unit increase in the Hs-CRP/HDL-C ratio corresponded to a 6% higher risk of sarcopenia (OR=1.06, 95% CI: 1.04-1.08, p=0.004). Participants in the highest quartile (≥2.75) of the Hs-CRP/HDL-C ratio had a 122% higher risk of sarcopenia compared to those in the lowest quartile (p=0.005). Subgroup analyses showed a stronger association in adults aged ≥40 years, with notable differences across races, especially among non-Hispanic Whites and other race. RCS model identified a non-linear association, with a threshold effect at a ratio of 0.86. The combined inflammatory and lipid markers Hs CRP/HDL-C showed stronger predictive performance (AUC: 0.685, 95% CI 0.666-0.703).
Conclusion: The Hs-CRP/HDL-C ratio can serve as a practical indicator to identify individuals at higher risk of sarcopenia, capturing the combined effects of chronic inflammation and lipid metabolism issues. This ratio may be useful for early detection and prevention efforts targeting sarcopenia. However, more prospective research is needed to confirm these findings..
Keywords: Hs-CRP/HDL-C ratio; NHANES; cross-sectional study; inflammation; lipid metabolism.
Copyright © 2025 Guo and Li.
Conflict of interest statement
The authors declare that the research was conducted in the absence of any commercial or financial relationships that could be construed as a potential conflict of interest.
Figures


References
-
- Fielding RA, Vellas B, Evans WJ, et al. Sarcopenia: an undiagnosed condition in older adults. Current consensus definition: prevalence, etiology, and consequences. International working group on sarcopenia. . J Am Med Dir Assoc. (2011) 12:249–56. doi: 10.1016/j.jamda.2011.01.003 - DOI - PMC - PubMed
MeSH terms
Substances
LinkOut - more resources
Full Text Sources
Medical
Research Materials
Miscellaneous