

An explainable AI approach to surgical and radiotherapy interventions for optimized treatment decision-making in early-stage non-small cell lung cancer
- PMID: 40673105
- PMCID: PMC12261364
- DOI: 10.21037/tlcr-2025-152
An explainable AI approach to surgical and radiotherapy interventions for optimized treatment decision-making in early-stage non-small cell lung cancer
Abstract
Background: For individual patients with early-stage non-small cell lung cancer (NSCLC), robust evidence to guide treatment selection between surgery and stereotactic body radiotherapy (SBRT) remains limited. This study aimed to develop machine learning-driven predictive models using the Surveillance, Epidemiology, and End Results (SEER) database to evaluate the efficacy of these treatments, thereby providing a data-driven foundation for personalized treatment decisions.
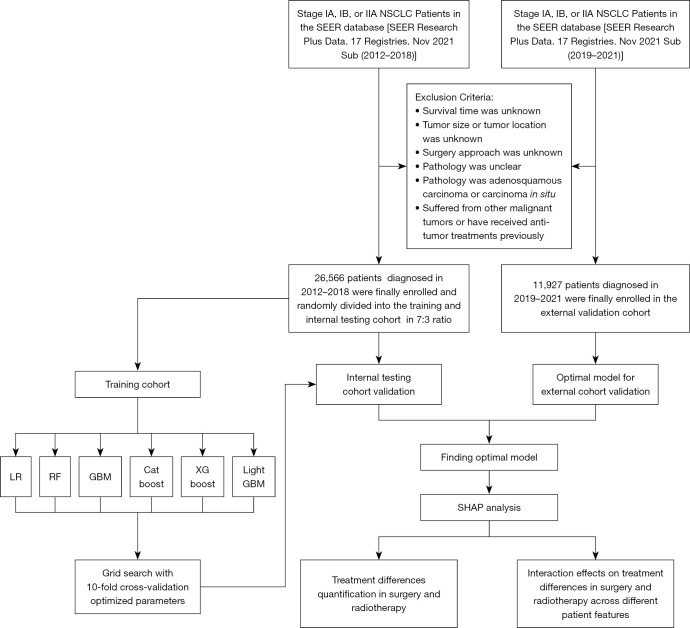
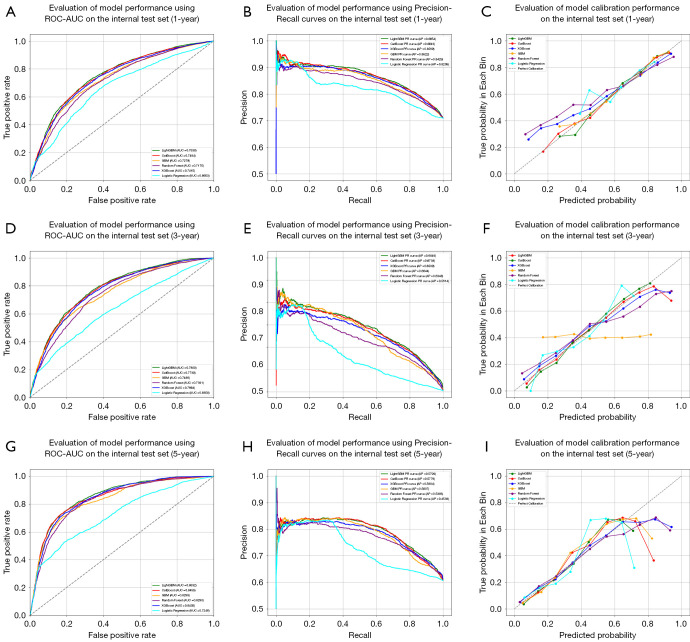
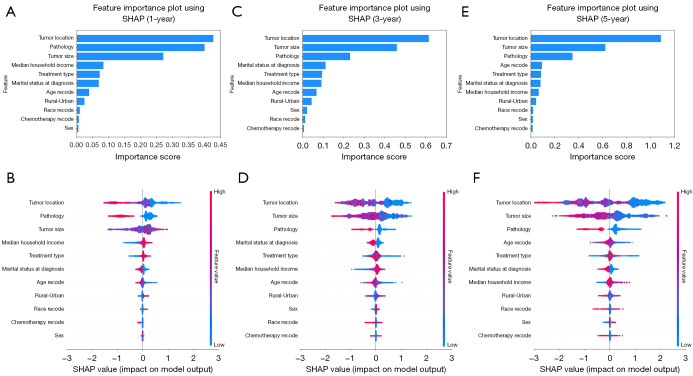
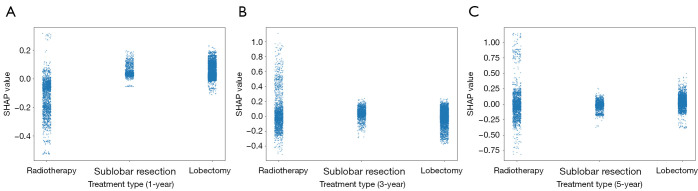
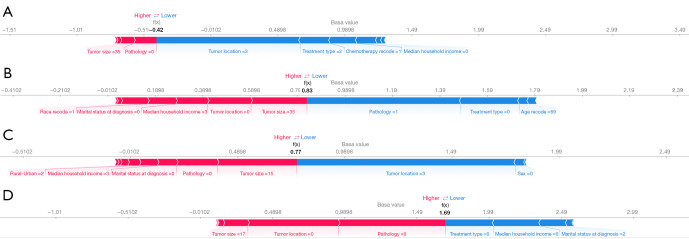
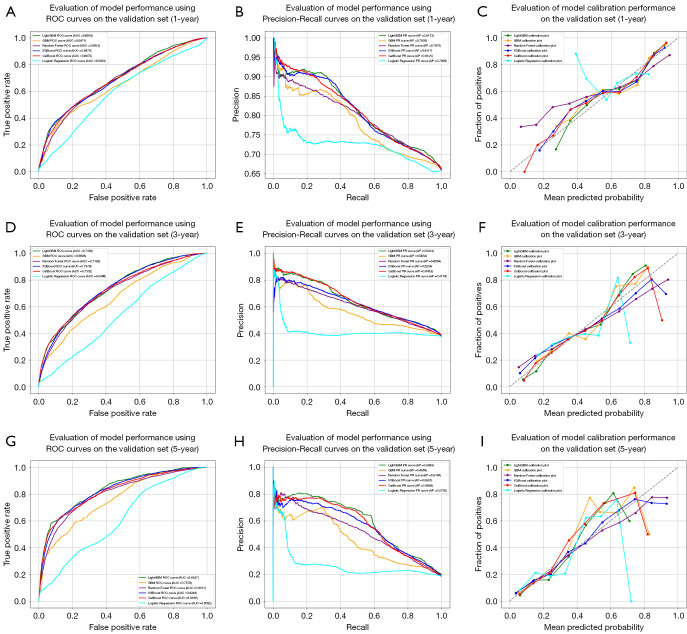
Methods: Stage I or IIA NSCLC patients diagnosed between 2012 and 2018 were identified from the SEER database. Six machine learning models, spanning from classical to advanced approaches, were employed to predict 1-, 3-, and 5-year survival, with their performance assessed using seven metrics. The SHAP (SHapley Additive exPlanations) interpretability method was employed to explain the optimal predictive model, focusing on analyzing the differences between surgical and radiotherapy treatments under various factors, providing valuable insights to optimizing treatment strategies. Patients diagnosed between 2019 and 2021 were selected as an external validation cohort to assess the generalizability and robustness of the previously developed models.
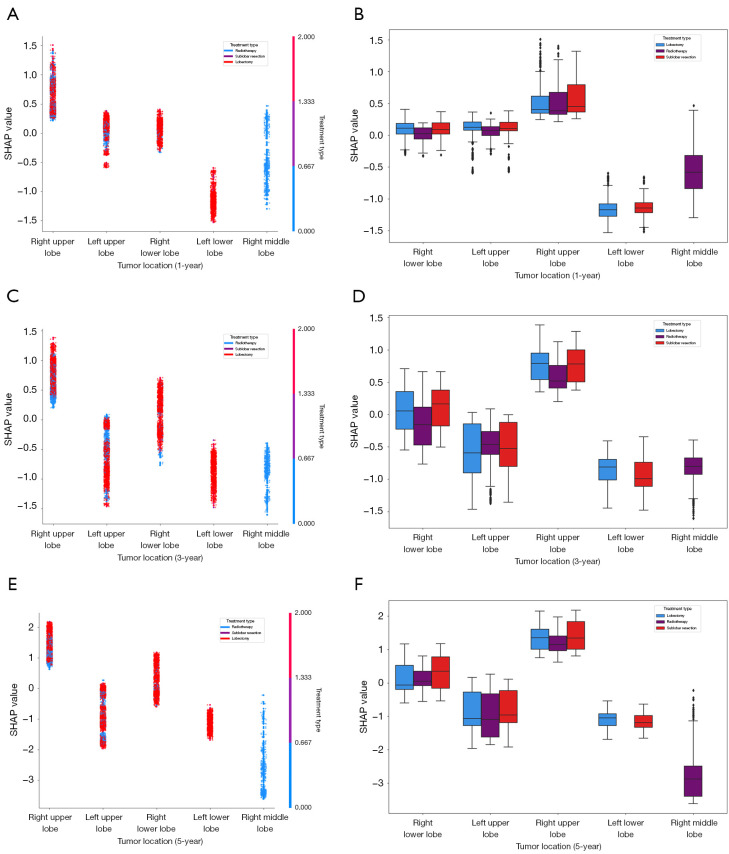
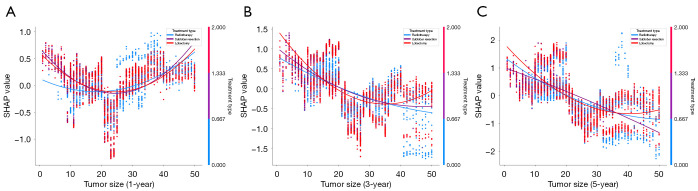
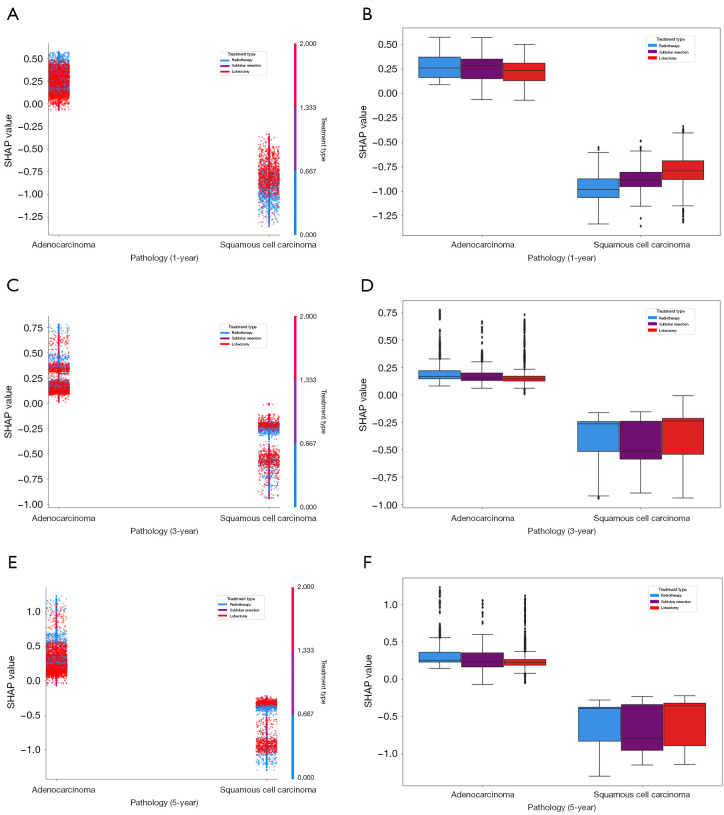
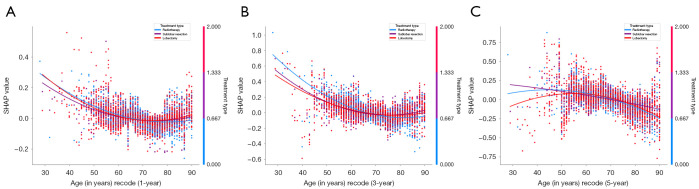
Results: A total of 26,566 patients were included in the training and internal testing cohort of the study. LightGBM (light gradient boosting machine) outperformed other models across most metrics for survival predictions. The SHAP interpretability analysis revealed that tumor location, tumor size, pathology, and treatment type were significant factors for 3- and 5-year predictions. Furthermore, at 3- and 5-year intervals, the efficacy of radiotherapy was comparable to surgery for left upper lobe tumors, while radiotherapy appeared slightly inferior to surgery for right lower lobe tumors. Meanwhile, for tumors <1.5 cm or 3.5-5 cm, lobectomy exhibited the best efficacy, while for tumors measuring 1.5-3.5 cm, the efficacy of lobectomy seemed to be slightly inferior to radiotherapy and sublobar resection. For adenocarcinoma and squamous cell carcinoma, radiotherapy and lobectomy could be regarded as the preferred treatment methods, respectively. Besides, for patients <45 or >75 years old, sublobar resection showed the best efficacy at the 5-year interval. The external validation cohort of 11,927 patients further confirmed the effectiveness of the models in predicting 1-, 3-, and 5-year survival outcomes, reinforcing their reliability and applicability in clinical decision-making.
Conclusions: This study provides valuable insights into treatment decision-making for stages I and IIA NSCLC. The LightGBM model is a reliable tool for survival prediction for early-stage NSCLC. By utilizing this model, it can be concluded that tumor location, tumor size, pathological type and age are vital factors significantly influencing the choice of treatment methods.
Keywords: Non-small cell lung cancer (NSCLC); SHAP interpretability; machine learning; stereotactic body radiotherapy (SBRT); surgery.
Copyright © 2025 AME Publishing Company. All rights reserved.
Conflict of interest statement
Conflicts of Interest: All authors have completed the ICMJE uniform disclosure form (available at https://tlcr.amegroups.com/article/view/10.21037/tlcr-2025-152/coif). The authors have no conflicts of interest to declare.
Figures
Similar articles
-
Comparison of Two Modern Survival Prediction Tools, SORG-MLA and METSSS, in Patients With Symptomatic Long-bone Metastases Who Underwent Local Treatment With Surgery Followed by Radiotherapy and With Radiotherapy Alone.Clin Orthop Relat Res. 2024 Dec 1;482(12):2193-2208. doi: 10.1097/CORR.0000000000003185. Epub 2024 Jul 23. Clin Orthop Relat Res. 2024. PMID: 39051924
-
Are Current Survival Prediction Tools Useful When Treating Subsequent Skeletal-related Events From Bone Metastases?Clin Orthop Relat Res. 2024 Sep 1;482(9):1710-1721. doi: 10.1097/CORR.0000000000003030. Epub 2024 Mar 22. Clin Orthop Relat Res. 2024. PMID: 38517402
-
Supervised Machine Learning Models for Predicting Sepsis-Associated Liver Injury in Patients With Sepsis: Development and Validation Study Based on a Multicenter Cohort Study.J Med Internet Res. 2025 May 26;27:e66733. doi: 10.2196/66733. J Med Internet Res. 2025. PMID: 40418571 Free PMC article.
-
Systemic pharmacological treatments for chronic plaque psoriasis: a network meta-analysis.Cochrane Database Syst Rev. 2021 Apr 19;4(4):CD011535. doi: 10.1002/14651858.CD011535.pub4. Cochrane Database Syst Rev. 2021. Update in: Cochrane Database Syst Rev. 2022 May 23;5:CD011535. doi: 10.1002/14651858.CD011535.pub5. PMID: 33871055 Free PMC article. Updated.
-
The effectiveness and cost-effectiveness of carmustine implants and temozolomide for the treatment of newly diagnosed high-grade glioma: a systematic review and economic evaluation.Health Technol Assess. 2007 Nov;11(45):iii-iv, ix-221. doi: 10.3310/hta11450. Health Technol Assess. 2007. PMID: 17999840
References
-
- Henschke CI, Yip R, Sun Q, et al. Prospective Cohort Study to Compare Long-Term Lung Cancer-Specific and All-Cause Survival of Clinical Early Stage (T1a-b; ≤20 mm) NSCLC Treated by Stereotactic Body Radiation Therapy and Surgery. J Thorac Oncol 2024;19:476-90. 10.1016/j.jtho.2023.10.002 - DOI - PubMed
LinkOut - more resources
Full Text Sources