. 2025 Jul 2:16:1605469.
doi: 10.3389/fmicb.2025.1605469. eCollection 2025.

Shiga toxin-producing Escherichia coli illness in Aotearoa | New Zealand, 2016-2022: epidemiological, genomic and traditional typing analyses provide insight into a significant endemic disease while highlighting knowledge gaps

Affiliations

Shiga toxin-producing Escherichia coli illness in Aotearoa | New Zealand, 2016-2022: epidemiological, genomic and traditional typing analyses provide insight into a significant endemic disease while highlighting knowledge gaps

Jacqueline Wright et al. Front Microbiol. .

Abstract

Introduction: Shiga toxin producing Escherichia coli (STEC) cause significant endemic disease in Aotearoa | New Zealand (NZ) with a 2022 case incidence rate of 19.9/100,000 population. The introduction of culture independent diagnostic testing has been pivotal in elucidating STEC case numbers.

Methods: Epidemiological data from 5,769 cases of STEC infection confirmed during the 7-year period 2016-2022 were reviewed in conjunction with epidemiological typing data from 3,746 case isolates (2,939 analyzed via whole genome sequencing).

Results and discussion: Severe illness was reported for 25% of all STEC cases, and 23% of cases were hospitalized. All age groups were affected, but the greatest level of morbidity was observed in those less than 5 years old where the hemolytic uremic syndrome (HUS) incidence rate was 2.86/100,000. Serotypes O157:H7 and O26:H11 together accounted for 54% of infections. Other common serotypes differed from those reported as common elsewhere and included O128:H2, O38:H26, O146:H21 and O91:H14. Shiga toxin subtype 2a strains were more associated with serious illness than other subtypes, regardless of eae positivity. Multiple STEC strains were inadvertently identified in 1.2% of culture positive case samples suggesting that carriage of more than one strain could be more prevalent. Single nucleotide polymorphism (SNP) analysis indicated that most STEC cases were sporadic as 5-SNP genomic clusters were uncommon. Infection sources are rarely proven as food and environmental sample data are limited and insufficient to assist in determining pathways to infection. By combining isolate WGS-derived typing data and case epidemiological data we demonstrated the importance of shifting the focus from a select number of STEC serogroups to composite seropathotypes-based on full serotype, ST, cgMLST relatedness and stx sub-toxin profile-to assist in understanding both the role of each type in disease severity, and relationships across historical type groups. This knowledge may be useful in future prioritizing of clinical and public health resources.

Keywords: STEC; Shiga toxin-producing Escherichia coli; epidemiological typing; epidemiology; seropathotype; severity; surveillance; whole genome sequencing.


Conflict of interest statement

The authors declare that the research was conducted in the absence of any commercial or financial relationships that could be construed as a potential conflict of interest.

Figures

FIGURE 1
FIGURE 1
NZ STEC case notification numbers and case incidence rates/100,000 population for the years 2002-2022 (EpiSurv extract 24th February 2023).
FIGURE 2
FIGURE 2
NZ STEC notification numbers by month and year, January 2014-December 2022. The date of introduction of culture-independent detection methods (CIDT) by six main diagnostic laboratories is marked, as is the date of introduction of national COVID-19 protection measures.
FIGURE 3
FIGURE 3
Age distribution of NZ STEC cases as a percentage of all cases, by disease severity for the years 2016-2022 (EpiSurv extract 24th February 2023).
FIGURE 4
FIGURE 4
Percentages of STEC case populations represented by prioritized ethnicities Asian, European/Other, Māori, Middle Eastern/Latin American/African (MELAA), Pacific peoples by disease severity (EpiSurv extract 24th February 2023).
FIGURE 5
FIGURE 5
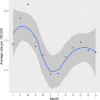
Seasonality of NZ STEC cases 2016-2022 shown as a combined average rate per 100,000 per month with 95% confidence intervals.
FIGURE 6
FIGURE 6
Top 20 serotypes confirmed from 3,746 STEC isolated from NZ cases of STEC infection 2016-2022, each shown as a percentage of all isolates from cases of infection, all isolates from cases of severe infection and all isolates from cases of HUS.
FIGURE 7
FIGURE 7
Stx subtypes for 1,193 STEC O157:H7 isolates (A) and 491 STEC O26:H11 isolates (B) from NZ cases of STEC infection 2016-2022, that underwent WGS analysis with each subtype shown as a percentage of all of isolates of that serotype from cases of infection, all isolates from cases of severe infection and all isolates from cases of HUS.
FIGURE 8
FIGURE 8
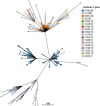
GrapeTree visualization of the cgMLST minimum spanning tree of all STEC isolated from NZ clinical cases 2016-2022, colored by serotype and highlighting the relative tree positions of O103:H25 ST343, O103:H8 ST2836, and O103:H2 ST17. The branch length scale is indicated by the number near the base of the tree.
FIGURE 9
FIGURE 9
GrapeTree visualization of the cgMLST minimum spanning tree of the 10 STEC ST17 serotypes isolated from NZ clinical cases 2016-2022: O103:H2, O153:H2, O15:H2, O123:H2, O145:H2, O111:H2, O118:H2, O177:H2, O45:H2, O71:H2. The visualized branch length is calculated by the GrapeTree algorithm, and the scale is indicated by the number near the base of the tree.
FIGURE 10
FIGURE 10
GrapeTree visualization of the cgMLST minimum spanning tree of the 18 seven gene multi locus sequence types of STEC O128:H2 strains isolated from NZ clinical cases 2016-2022. The branch length scale is indicated by the number near the base of the tree.
FIGURE 11
FIGURE 11
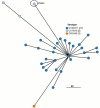
GrapeTree visualization of the cgMLST minimum spanning tree of the three serotypes of NZ clinical cases of STEC ST297 (O130:H11; O93:H46; O179:H8) and related isolate O179:H8 ST ST9860 isolated from NZ clinical cases 2016-2022. The branch length scale is indicated by the number near the base of the tree.
FIGURE 12
FIGURE 12
iTOL visualization of IQ-tree generated maximum likelihood tree of NZ STEC O157:H7 case strains 2016-2022 annotated to show clustering by stx subtype.
FIGURE 13
FIGURE 13
iTOL visualization of IQ-tree generated maximum likelihood tree of NZ STEC O26:H11 case strains 2016-2022 annotated to show stx subtype and relatedness of SnapperDB assigned clustering.

References

    1. Achtman M., Zhou Z., Charlesworth J., Baxter L. (2022). EnteroBase: Hierarchical clustering of 100 000s of bacterial genomes into species/subspecies and populations. Philos. Trans. R. Soc. B 377 20210240. 10.1098/rstb.2021.0240 - DOI - PMC - PubMed
    1. Adlam S. B., Perera S., Lake R. J., Campbell D. M., Williman J. A., Baker M. G. (2011). Acute gastrointestinal illness in New Zealand: A community study. Epidemiol. Infect. 139 302–308. 10.1017/S0950268810000932 - DOI - PubMed
    1. Argimón S., Abudahab K., Goater R. J. E., Fedosejev A., Bhai J., Glasner C., et al. (2016). Microreact: Visualizing and sharing data for genomic epidemiology and phylogeography. Microb Genom. 2:e000093. 10.1099/mgen.0.000093 - DOI - PMC - PubMed
    1. Ashton P. M., Perry N., Ellis R., Petrovska L., Wain J., Grant K. A., et al. (2015). Insight into Shiga toxin genes encoded by Escherichia coli O157 from whole genome sequencing. PeerJ 3:e739. 10.7717/peerj.739 - DOI - PMC - PubMed
    1. Ausdiagnostics (2023). Faecal Bacteria and Parasites 12-Well Ref 25041. Available online at: https://www.ausdiagnostics.com/content/uploads/2023/04/25041-r07.pdf (accessed February 10, 2025).

LinkOut - more resources