Multicenter Study
. 2025 Jul;14(14):e71054.
doi: 10.1002/cam4.71054.

Prognostic Value of Deep Learning-Extracted Tumor-Infiltrating Lymphocytes in Esophageal Cancer: A Multicenter Retrospective Cohort Study

Affiliations
Multicenter Study

Prognostic Value of Deep Learning-Extracted Tumor-Infiltrating Lymphocytes in Esophageal Cancer: A Multicenter Retrospective Cohort Study

Peishen Li et al. Cancer Med. 2025 Jul.

Abstract

Background: Tumor-infiltrating lymphocytes (TILs) have been proven to be important prognostic factors for various tumors. However, their prognostic significance within the context of esophageal squamous cell carcinoma (ESCC) remains inadequately explored. This study aims to assess the prognostic potential of TILs in ESCC using deep learning (DL) methods.

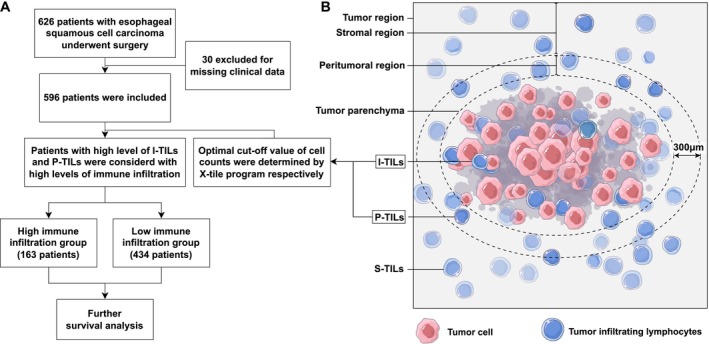
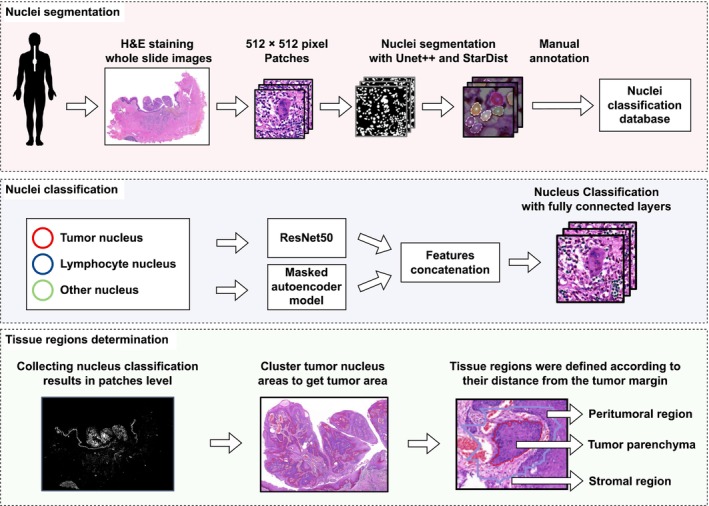
Materials and methods: We retrospectively enrolled 626 pathologically confirmed ESCC patients from two research centers. Their digital whole-slide imaging (WSI) and corresponding clinical information were collected. Subsequently, the DL method was employed to identify the tumor margin and TILs within the WSI. Tissue was divided into intratumor, peritumoral, and stromal regions based on their distance from the tumor margin. TILs were counted in each region. Optimal cut-off values of TILs were determined using the X-tile software. To mitigate selection bias and intergroup heterogeneity, a propensity score matching (PSM) analysis was employed. Survival analysis was performed using Kaplan-Meier curves and the log-rank test. The Cox proportional hazards regression model was used to identify independent prognostic factors.

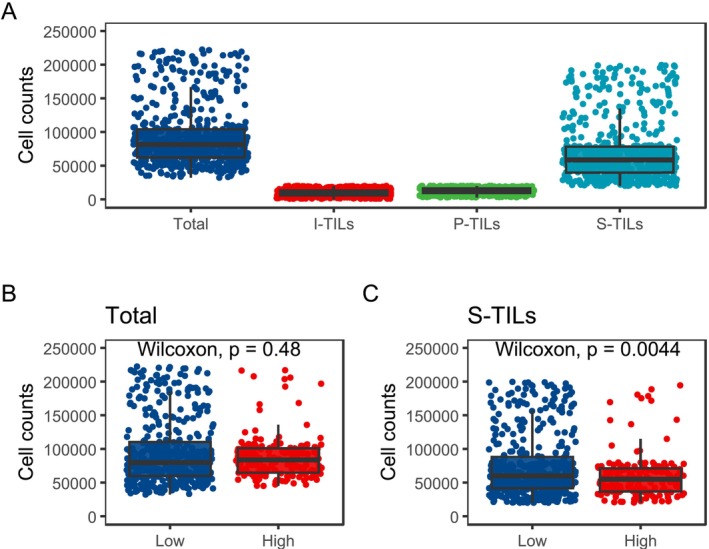
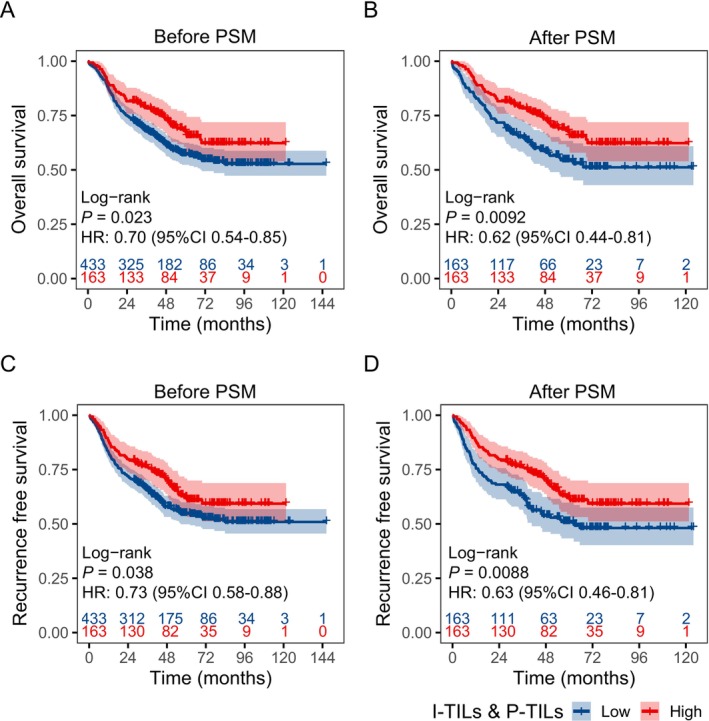
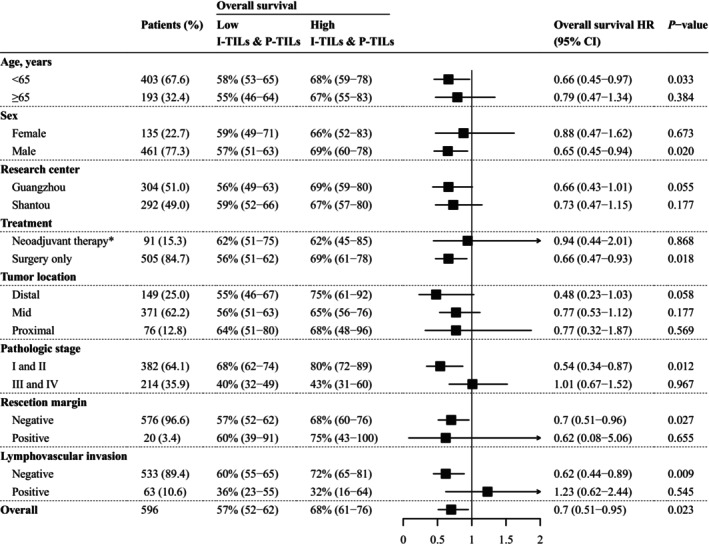
Results: We classified patients based on the cell counts and cut-off values of intratumor-infiltrating lymphocytes (I-TILs) and peritumoral infiltrating lymphocytes (P-TILs). Patients with high I-TILs and P-TILs were defined as those whose counts of both I-TILs and P-TILs exceeded the determined cutoff value. Patients with high I-TILs and P-TILs showed significantly better overall survival (OS, p = 0.0092) and recurrence-free survival (RFS, p = 0.0088) than patients with low I-TILs and P-TILs after PSM. Multivariable Cox proportional hazards regression further supported this conclusion and recognized I-TILs and P-TILs as independent prognostic factors (p = 0.0136, hazard ratio = 0.63 for OS; p = 0.0098, hazard ratio = 0.63 for RFS).

Conclusion: In the present study, we identified the quantitative distribution of TILs in ESCC patients with the help of the DL method. We established that I-TILs and P-TILs serve as independent prognostic factors for these patients. Further studies should focus on the lymphocyte subgroups and make better use of the spatial information to improve the predictive efficacy of TILs.

Keywords: deep learning; esophageal squamous cell carcinoma; prognostic factors; tumor‐infiltrating lymphocytes.


Conflict of interest statement

The authors declare no conflicts of interest.

Figures

FIGURE 1
FIGURE 1
Study flowchart and tumor region division. (A) Study flowchart for the present study. (B) Division of tumor regions and lymphocyte nomenclature in different regions. The peritumoral region was defined as the area within a distance of up to 300 μm from the tumor margin. I‐TILs, intra‐tumor infiltrating lymphocytes; P‐TILs, peritumoral infiltrating lymphocytes; S‐TILs, stomal tumor infiltrating lymphocytes.
FIGURE 2
FIGURE 2
Workflow for TILs detection and tissue regions determination. Red: to establish a nuclei classification database, H&E stained whole slide images were broken into patches and cell and nuclei were segmented with U‐Net++ and StarDist. All the nuclei were manually annotated by pathologists. Blue: We fused the features extracted from ResNet50 and the Masked auto‐encoder model and used fully connected layers to achieve the classification of cell nuclei. Green: The tumor region was identified through clustering of the tumor nucleus region and the tissue regions were delineated according to their distance from the tumor margin. TILs, tumor infiltrating lymphocytes.
FIGURE 3
FIGURE 3
Cell counts distribution of TILs. (A) Distribution of TILs, S‐TILs, I‐TILs, and P‐TILs. (B, C) Distribution of (B) TILs and (C) S‐TILs according to I‐TIL and P‐TIL levels. I‐TILs, intratumor infiltrating lymphocytes; P‐TILs, peritumoral infiltrating lymphocytes; S‐TILs, Stomal tumor infiltrating lymphocytes; TILs, Tumor infiltrating lymphocytes.
FIGURE 4
FIGURE 4
Kaplan–Meier plots for OS and RFS for patients with different I‐TIL and P‐TIL levels. (A) Kaplan–Meier plots for OS before PSM. (B) Kaplan–Meier plots for OS after PSM. (C) Kaplan–Meier plots for RFS before PSM. (D) Kaplan–Meier plots for RFS after PSM. I‐TILs, intratumor infiltrating lymphocytes; OS, overall survival; PSM, propensity score matching; P‐TILs, peritumoral infiltrating lymphocytes; RFS, recurrence‐free survival.
FIGURE 5
FIGURE 5
Forest plot for 5‐year overall survival hazard ratios. High I‐TILs and P‐TILs were defined as patients with both intratumor infiltrating lymphocyte count and peritumoral infiltrating lymphocyte count exceeding the cutoff value. Patients who did not meet the criteria were considered to have low I‐TILs and P‐TILs. *Patients in the neoadjuvant therapy subgroup received platinum and fluorouracil‐based neoadjuvant therapy, along with other antitumor agents such as targeted therapy or immunotherapy according to their toleration and gene mutation status. HR, hazard ratios; I‐TILs, intratumor infiltrating lymphocytes; P‐TILs, peritumoral infiltrating lymphocytes.

Similar articles

References

    1. Siegel R. L., Miller K. D., Wagle N. S., and Jemal A., “Cancer Statistics, 2023,” CA: A Cancer Journal for Clinicians 73, no. 1 (2023): 17–48, 10.3322/caac.21763. - DOI - PubMed
    1. NCCN Guidelines for Patients: Esophageal Cancer , “Esophageal Cancer” (2022), https://www.nccn.org/patients/guidelines/content/PDF/esophageal‐patient.pdf.
    1. Kouzu K., Nearchou I. P., Kajiwara Y., et al., “Deep‐Learning‐Based Classification of Desmoplastic Reaction on H&E Predicts Poor Prognosis in Oesophageal Squamous Cell Carcinoma,” Histopathology 81, no. 2 (2022): 255–263, 10.1111/his.14708. - DOI - PubMed
    1. Sasagawa S., Kato H., Nagaoka K., et al., “Immuno‐Genomic Profiling of Biopsy Specimens Predicts Neoadjuvant Chemotherapy Response in Esophageal Squamous Cell Carcinoma,” Cell Reports Medicine 3, no. 8 (2022): 100705, 10.1016/j.xcrm.2022.100705. - DOI - PMC - PubMed
    1. Li J., Tang Y., Huang L., et al., “A High Number of Stromal Tumor‐Infiltrating Lymphocytes Is a Favorable Independent Prognostic Factor in M0 (Stages I–III) Esophageal Squamous Cell Carcinoma,” Diseases of the Esophagus 30, no. 1 (2017): 1–7, 10.1111/dote.12518. - DOI - PubMed

Publication types