Review
. 2025 Jul 17.
doi: 10.1039/d4cs00500g. Online ahead of print.

Supramolecular chemistry for optical detection and delivery applications in living plants

Affiliations
Review

Supramolecular chemistry for optical detection and delivery applications in living plants

Maria Vittoria Balli et al. Chem Soc Rev. .

Abstract

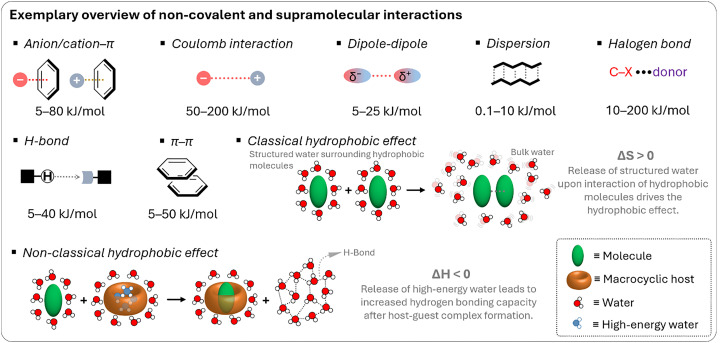
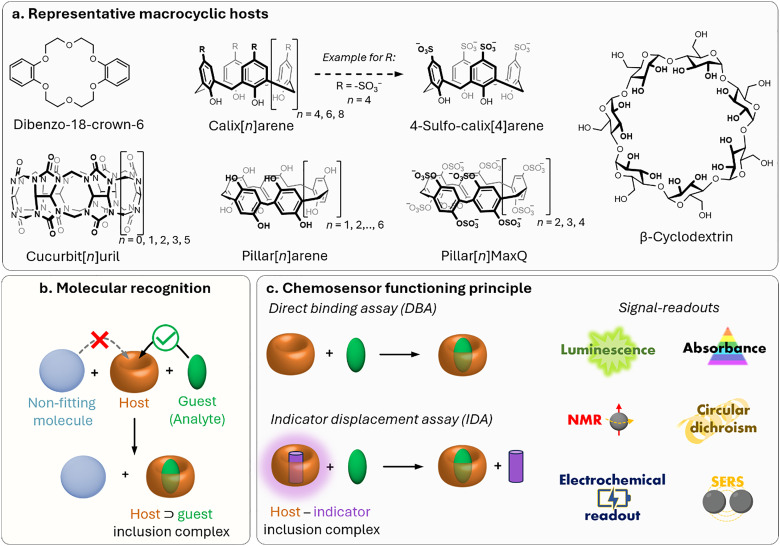
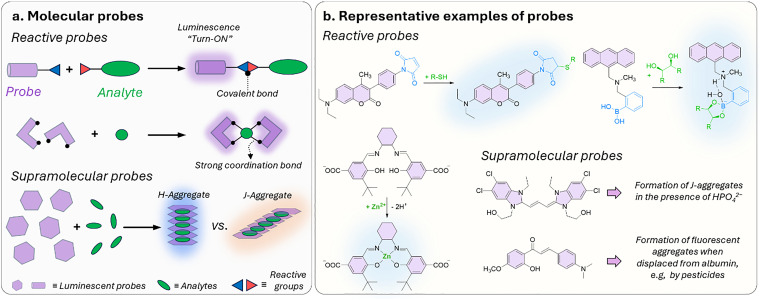
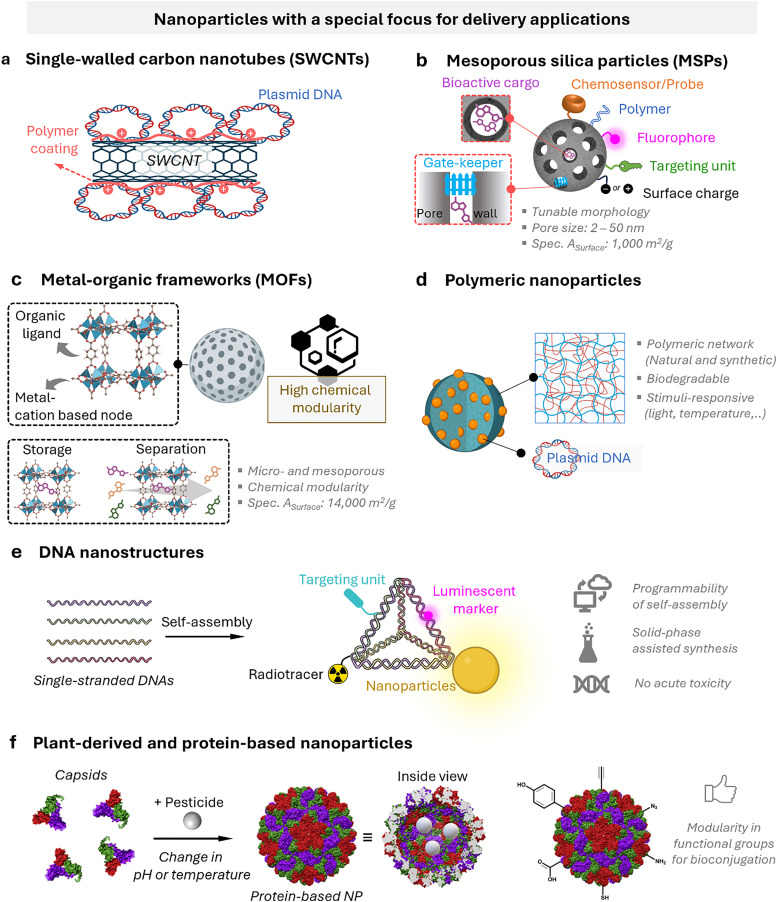
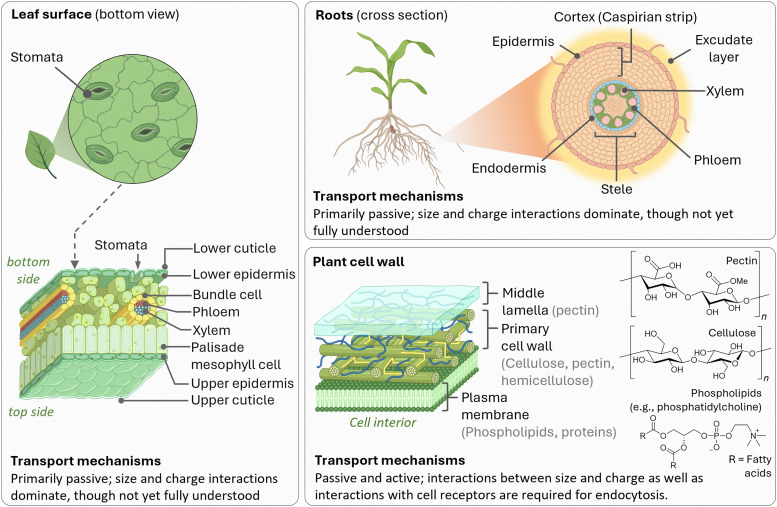
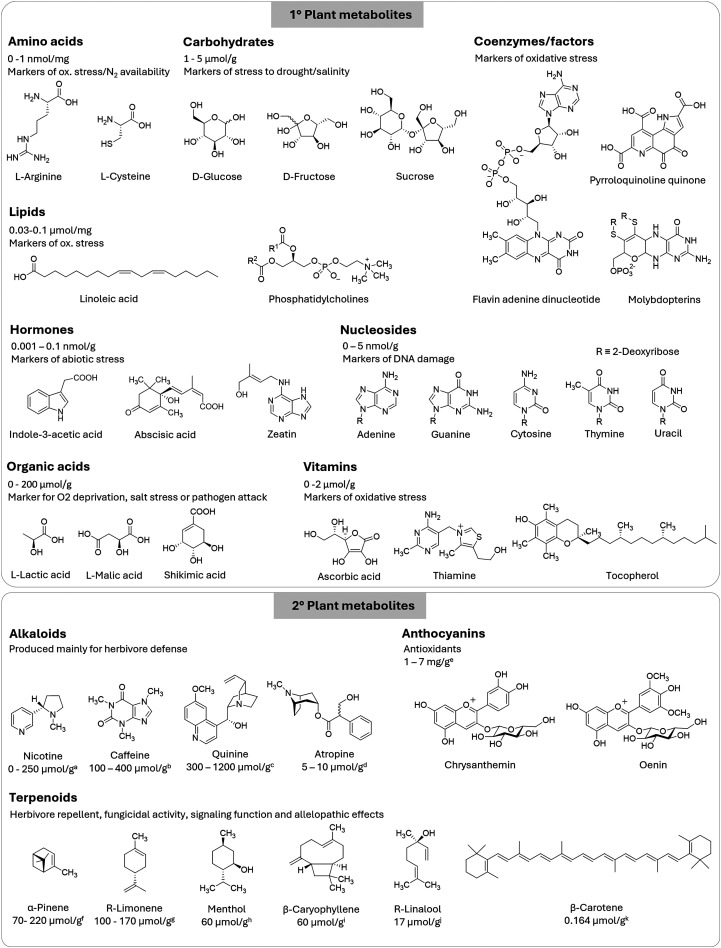
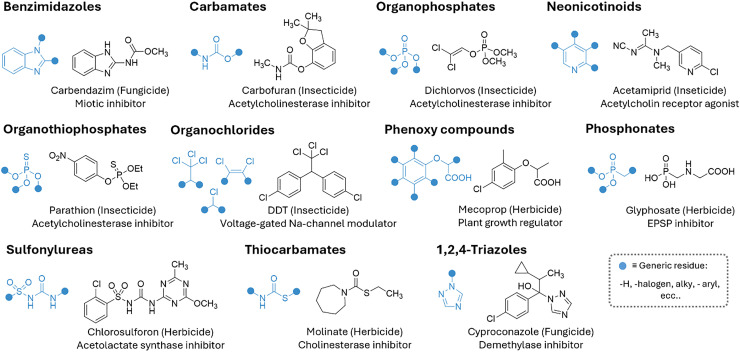
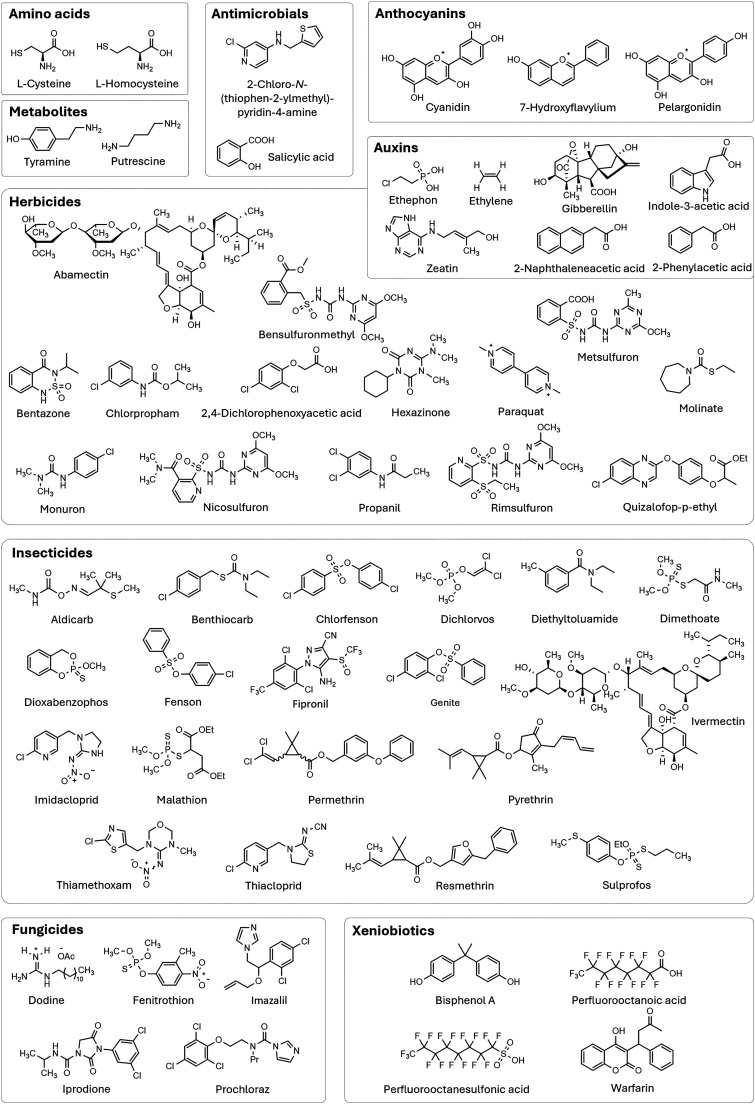
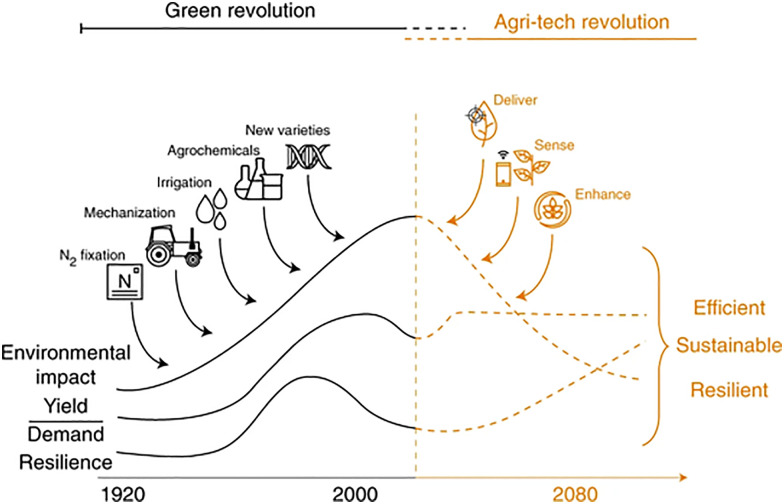
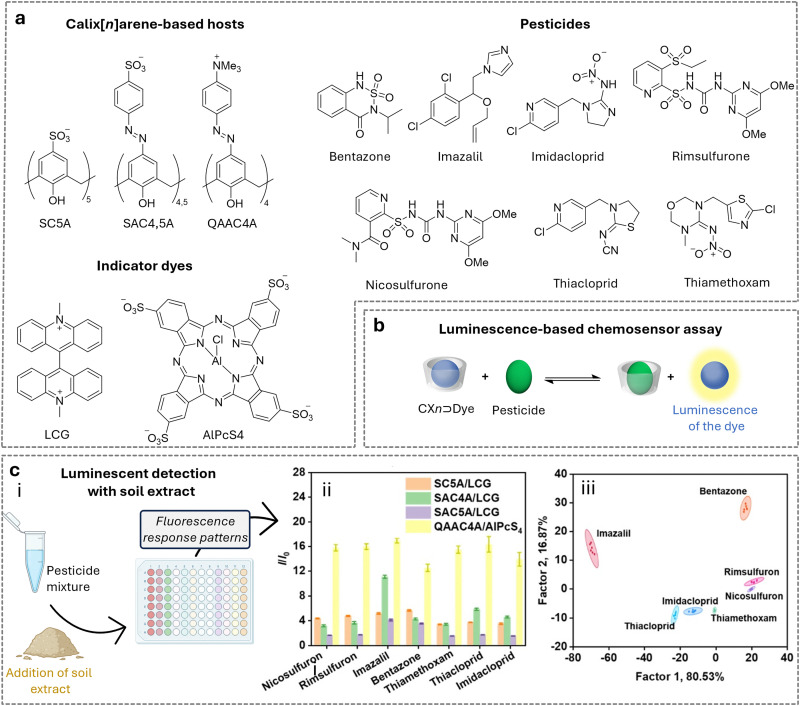
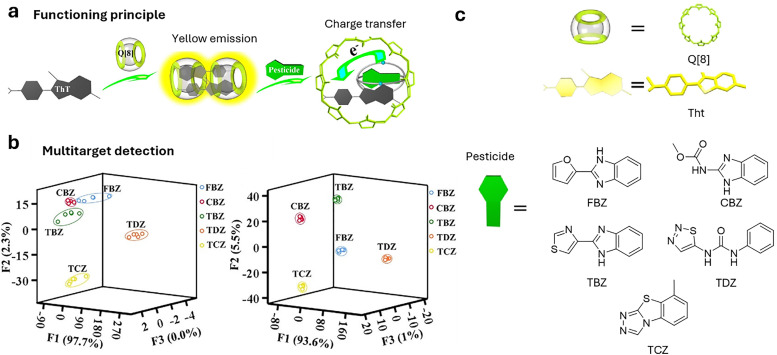
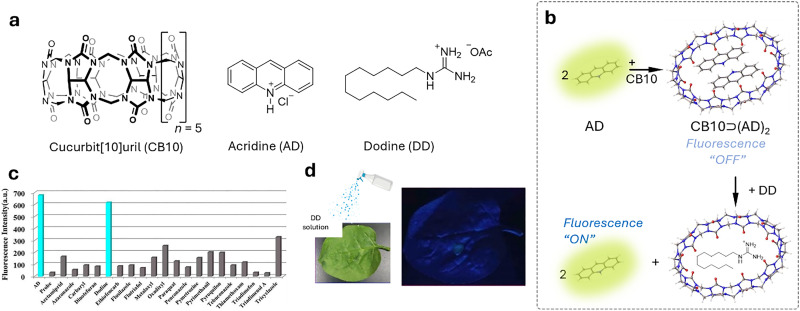
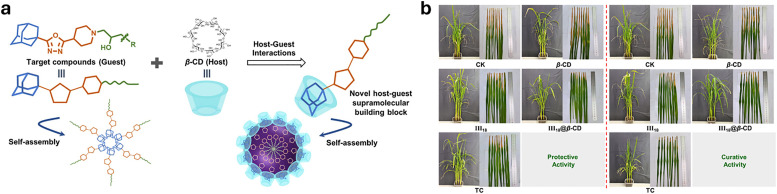
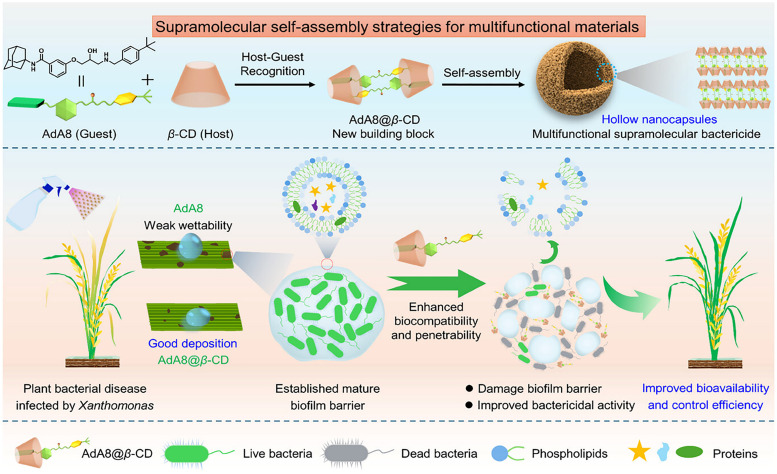
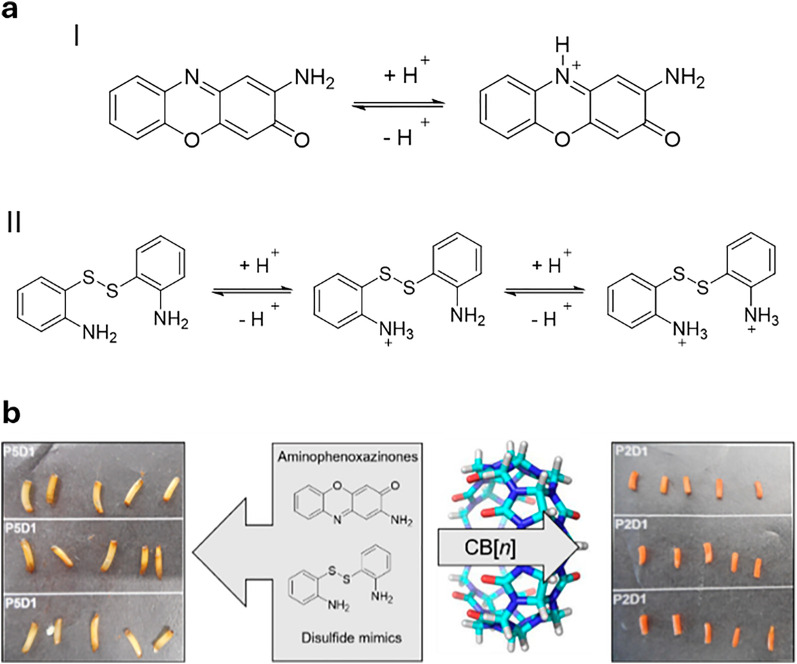
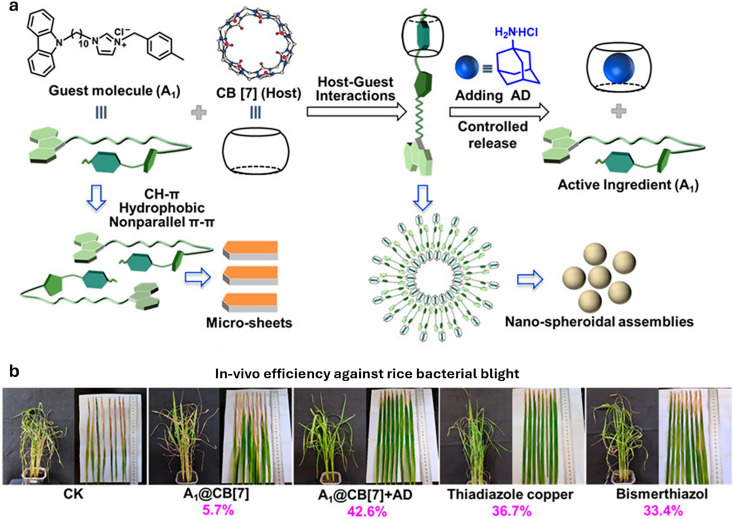
Over the past century, modern agriculture, through the use of synthetic fertilisers, pesticides, and improved plant breeding, has greatly increased food production. However, this progress has brought serious environmental consequences, including excessive water use and harmful pesticide exposure. In addition, future farming must adapt to the growing challenges posed by climate change and natural disasters through more sustainable practices and resilient crop management. In this context, emerging supramolecular strategies offer promising alternatives through responsive molecular assemblies capable of precise sensing and controlled delivery. In this review, we thus discuss the application of supramolecular chemistry principles to plant science and agriculture, with a particular emphasis on the design and implementation of host-guest systems, chemosensors, and supramolecular (nano)delivery vehicles for use in living plants. We report and analyse recent advances in sensing and monitoring of plant processes, the detection of pesticides, the preparation of safer and more effective supramolecular pesticides, and nucleic acid-based crop protection strategies, highlighting key design principles specific to the plant biological context. Moreover, key challenges are discussed regarding the application of supramolecular systems to plants, and examples are highlighted to promote new interdisciplinary strategies for designing next-generation tools for real-time, in vivo plant studies and sustainable crop management.


Conflict of interest statement

There are no conflicts to declare.

Figures

Fig. 1
Fig. 1. Types of supramolecular interactions and related interaction strengths (average ranges derived from experimental and theoretical calculations).
Fig. 2
Fig. 2. (a) Chemical structures of the most prominent macrocyclic hosts for sensor and delivery applications. For calix[n]arene, the residue R can be, for example: –alkyl, –SO3, –CH2–CH2–COO, –CH2–NH3+, –CH2–PO32−. (b) Host–guest inclusion complex formation occurs when the guest molecule fits into the host's cavity, and intermolecular non-covalent interactions, such as those described in Section 1.2, promote the formation of the complex. This process enables the selective binding of molecular species, leading to the concept of molecular recognition. (c) Basics of the main functioning principles for chemosensors DBA, IDA, and main signal readouts such as nuclear magnetic resonance (NMR) spectroscopy, circular dichroism, electrochemical readout, and surface-enhanced Raman scattering (SERS).
Fig. 3
Fig. 3. (a) Schematic representation of reactive and supramolecular probes, and (b) examples of their applications. Except for the boronic ester-containing probe, which is adapted from ref. , all other examples are discussed within this review.
Fig. 4
Fig. 4. Representative examples of nanomaterials used for developing nanosensors in plant research, i.e., (a) genetically encoded protein-based nanoparticles, (b) semiconducting single-walled carbon nanotubes, (c) plasmonic nanoparticles (e.g., gold and silver nanoparticles), (d) nanoparticles-based (electrochemical) sensors.
Fig. 5
Fig. 5. Representative examples of nanoparticles used for the delivery of bioactive molecules to plants include: (a) single-walled carbon nantorubes, (b) mesoporous silica nanoparticles, (c) metal–organic frameworks, (d) polymeric nanocarriers, (e) DNA nanostructures, (f) plant-derived and protein-based nanoparticles, e.g., virus capsid nanoparticles.
Fig. 6
Fig. 6. Schematic representation of the generalized structural barriers in plants those exogenous substances, such as chemosensors and nanomaterials, must traverse to reach plant cells. The illustration highlights the principal transport mechanisms involved, along with representative chemical structures of key cell membrane components.
Fig. 7
Fig. 7. Chemical structures of exemplary primary and secondary plant metabolites and their respective roles in plants. For the primary metabolites, the concentration levels represent a general average typically found in Arabidopsis thaliana. Concentration levels for secondary metabolites are averaged across various plant species: (a) tobacco plant; (b) green tea leaves; (c) Cinchona bark; (d) Atropa belladonna; (e) fruits; (f) Rosmarinus officinalis leaves; (g) lemon peels; (h) oil of Mentha canadensis; (i) Piper nigrum; (j) basil; (k) potato leaves.
Fig. 8
Fig. 8. Representative list and chemical structures of the most common pesticides.
Fig. 9
Fig. 9. Representative examples of pesticides and plant metabolites discussed in this review.
Fig. 10
Fig. 10. The green revolution and the new agritech revolution. Image adapted with permission from ref. .
Fig. 11
Fig. 11. (a) Chemical structures of βCD, AIETPA, trans-zeatin, and a schematic representation of the trans-zeatin-selective aptamer. (b) Working principle of fluorescent intracellular trans-zeatin imaging: binding of the aptamer to trans-zeatin reduces its affinity for the host, allowing it to be displaced by the AIETPA dye, which exhibits enhanced fluorescence upon forming a host–guest complex with the macrocycle. (c) Fluorescence imaging of trans-zeatin bioactivity in wheat coleoptiles. Figure adapted with permission from ref. .
Fig. 12
Fig. 12. (a) Chemical structures of SCn, PyFlav in its protonated (AH+) and non-protonated (AN) forms, and the chemical structures of selected bioamines. (b) Schematic representation of the IDA principle for bioamine detection. Left: UV-Vis detection is enabled by the displacement of PyFlav, which shifts the equilibrium toward the AN form in the uncomplexed state, characterized by a distinctly more red-shifted absorption compared to the AH+ form. Right: Luminescence-based detection of putrescine is achieved through supramolecular displacement: only the unbound form of the dye AH+ released from the SC4·AH+ complex upon analyte binding exhibits strong emission, whereas the complexed state is effectively quenched. (c) (i) UV-Vis absorbance-based detection of putrescine using the SC4⊃PyFlav (2 mM) chemosensor in 10 mM PB at pH 7.2. The inset shows the change in absorbance at 500 nm as a function of increasing putrescine concentration for SC4⊃PyFlav, SC6⊃PyFlav (2 mM), and SC8⊃PyFlav (1 mM) chemosensors. (ii) UV-Vis absorbance-based detection of tyramine. (iii) Fluorescence-based detection of putrescine with the SC4⊃PyFlav chemosensor (cPyFlav = 3.2 μM, cSC4 = 700.0 μM); λex = 440 nm. Images adapted from ref. .
Fig. 13
Fig. 13. (a) Chemical structures of CXn-based host molecules, fluorescent dyes, and pesticide analytes. (b) Schematic illustration of the operating principle underlying the chemosensor assays employed for pesticide detection. (c) (i) Schematic representation of the operating principle, and (ii) fluorescence response patterns of the sensor array (cCXn = 2.0 μM, cdye = 2.0 μM) toward various pesticides in the presence of 20% soil extract. (iii) Canonical score plot derived from linear discriminant analysis of the fluorescence response patterns in the presence of 20% soil extract, including 95% confidence ellipses (n = 6). Adapted with permission from ref. .
Fig. 14
Fig. 14. (a) Proposed mechanism of fluorescence quenching in the ThT@Q[8] system. Its application enables multitarget detection of five aromatic pesticides under single-wavelength excitation (λex = 365 nm), including in a paper-strip-based assay. (b) Canonical score plot from LDA for the discrimination of pesticides in tap water (left) and Huaxi river water (right). (c) Cartoon representations of Q[8] and ThT, as well as the chemical structures of the tested pesticides. Adapted with permission from ref. .
Fig. 15
Fig. 15. (a) Chemical structures of CB10, the indicator dye acridine, and the pesticide dodine. (b) Schematic representation of the fluorescence-based guest displacement assay, where the presence of a strongly binding analyte, such as dodine, enables the displacement of the indicator dye from the macrocycle's cavity. (c) Fluorescence response of 20 pesticides (10 equivalents of the host–guest complex) on the relative fluorescence intensity (λem = 472 nm) of CB10⊃(AD)2. (d) Photographs of G. cusimbua treated with dodine (5.0 × 10⁻⁷ M solution). Adapted with permission from ref. .
Fig. 16
Fig. 16. (a) Chemical structures of adamantane (AD)-modified rhodamine derivative (RAD), and when it is bound to CB7 and salicylic acid (SA). (b) Functioning principle of the chemosensor response to SA, highlighting the SA-induced spirolactam ring opening of RAD, which leads to the observed fluorescence enhancement. (c) (i) Schematic diagram of the CB7⊃RAD chemosensor for SA detection in Arabidopsis thaliana. (ii) Fluorescence microscopy images of SA detection in Arabidopsis thaliana roots, stems, and leaves. Scale bars = 100 μm. (iii) Relative fluorescence intensity of Arabidopsis thaliana segments. Adapted with permission from ref. .
Fig. 17
Fig. 17. (a) Chemical structures of CB8, coumarin-based indicator dyes, and the pesticides used for detection. (b) Schematic representation of the ratiometric chemosensor assay's working principle. (c) Fluorescence emission spectra of the S1 chemosensor in the presence of pesticides in water (λex = 481 nm). (d) Heat map showing the chemosensor's wavelength-dependent response to different pesticides. (e) Canonical score plot from the LDA analysis for pesticide discrimination in water. (f) Photograph of Chinese cabbage seedlings treated with deionised water and PQ (1 mM) for 5 days. Qualitative detection of Chinese cabbage seedling extract using S1. Adapted with permission from ref. .
Fig. 18
Fig. 18. (a) Chemical structures of the ammonium and alkyne-rim differentiated pillar[5]arene (RD-P5), PFOA and PFOS. (b) Schematic representation of RD-P5 immobilisation via CuAAC onto an azide-functionalised Al2O3 surface. (c) Contact angle-based detection of PFOA and PFOS. (d) The plot of contact angle (CA) versus PFOS/PFOA concentration (left) and CA response for different compounds at 100 mg L−1 in mixed sample compositions (right). Figure adapted with permission from ref. .
Fig. 19
Fig. 19. (a) Chemical structure and detection mechanism of reactive sulfur species by SSNIP. (b) Confocal microscopy images of Arabidopsis thaliana at different growth stages (9, 15, 21, 27 days), incubated with 50 μM SSNIP for 25 minutes, followed by replacement with fresh PBS before imaging (λex = 560 nm, scale bar = 10 μm). (c) Normalisation of the confocal microscopy imaging data. (d) Normalised imaging data (each set representing three Arabidopsis thaliana samples for one specific growth stage). Figure adapted with permission from ref. .
Fig. 20
Fig. 20. (a) Chemical structure and reaction mechanism of the thiol-selective probe (addition reaction). (b) Confocal imaging of the probe (10 μM) incubated with Cys in Arabidopsis root tip. (A1) Arabidopsis root tip incubated with the probe (10 μM) for 5 minutes; (A2) co-incubation of the probe with Cys (200 μM) for 5 minutes (blue channel: λem = 420–550 nm, λex = 405 nm). Figure adapted with permission from ref. .
Fig. 21
Fig. 21. (a) Schematic representation of the binding and signal transduction mechanism of receptor 1 upon interaction with PFAS. The chemical structures of receptor 1 and a representative PFAS are also shown. (b) Luminescence response of receptor 1 (1.0 μM) upon addition of varying concentrations of PFOA (0–5.0 μM) in hexane (λex = 340 nm). The inset displays photographs of the hexane solutions under UV irradiation (λex = 365 nm). (c) Photographs of hexane solutions containing receptor 1 (1.0 μM) after contact with PFOA (up to 10 ppb) initially present in either deionized water or tap water. Figure adapted with permission from ref. .
Fig. 22
Fig. 22. (a) X-ray crystal structures of BSA and Try, adapted from the RCSB Protein Data Bank. (b) Schematic diagram of the preparation and detection mechanism of the BAAT probe, along with the fluorescence spectra. (c) Spatial (top) and temporal (bottom) monitoring of ABA concentrations in plant tissues using the BAAT probe, including the detection of endogenous ABA content in plant roots via fluorescence imaging. Figure adapted with permission from ref. .
Fig. 23
Fig. 23. (a) Chemical structure of Rh6G-based probes and SA-mediated conversion of the spirolactam structure from a ring-closed to a ring-opened form, resulting in a significant enhancement of fluorescence. (b) Schematic illustration of SA imaging in different plant parts. (b) Two-photon fluorescence imaging of SA in B. chinensis L. plants were first incubated with the probe (10 μM) for 10 minutes, followed by incubation with water containing SA (125 μM) for various times to image different parts, i.e., (A)–(C) root tip, (D)–(F) rootstock, and (G)–(I) leaf. (c) Schematic illustration of the leaf staining experiment and photos of the leaf: the left image shows the leaf under natural light, and the right image shows it under ultraviolet light (probe Rh6G-Py: 100 μM; SA: 1 mM). Figure adapted with permission from ref. .
Fig. 24
Fig. 24. (a) Chemical structure of Cy-CO2Bz. This probe enables in vivo tracking of NaCl in plants through its fluorescence response to elevated salt levels. (b) Absorption spectra of Cy-CO2Bz in PBS (150 mM, pH 7.4, cCy-CO2Bz = 10 μM, 1% DMSO as cosolvent) with various salts (cCy-CO2Bz = csalts = 200 mM). (c) Fluorescence spectra of Cy-CO2Bz (K) and Cy-CO2Et in water with different NaCl concentrations (λex = 740 nm; c(Cy-CO2Bz) = 10 μM, 1% DMSO as cosolvent). (d) In vivo images of plants treated with different NaCl concentrations in deionised water and incubated with Cy-CO2Bz for 5 hours. Figure adapted with permission from ref. .
Fig. 25
Fig. 25. (a) Chemical structures of the chemosensor CPM and the pesticide quizalofop-p-ethyl. (b) Photographs of food samples (citrus, kiwifruit, and cucumber) for quizalofop-p-ethyl detection under UV light (365 nm). The samples were sprayed with a solution of quizalofop-p-ethyl and a solution of CPM successively. Figure adapted with permission from ref. .
Fig. 26
Fig. 26. (a) Design and mechanism of the 4MC-ALB complex for ratiometric detection of FPN. (b) Staining and treatment procedure for in situ tracking of FPN. Fluorescence imaging of Arabidopsis thaliana root segments: the first row shows the control group incubated in nutrient solution for 5 min. The second row shows incubation in 4MC-spiked solution for 5 min. The third row shows incubation in 4MC@ALB-spiked solution for 5 min, followed by nutrient solution for another 5 min. The fourth row shows incubation in 4MC@ALB-spiked solution for 5 min, then transferred to FPN-spiked solution for another 5 min. Scale bar: 250 μm. Figure adapted with permission from ref. .
Fig. 27
Fig. 27. (a) Glucose sensing with glucose aptamer sensor delivered via thiol-mediated uptake in WT Arabidopsis and Arabidopsis atsweet[11;12] double mutants. Schematic illustration of the infiltration, uptake of SS-HS/glucose aptamer sensor, and the glucose aptamer sensor's FRET ratio change after conformation rearrangement upon binding to glucose in WT Arabidopsis and Arabidopsis atsweet[11;12] double mutants. (b) The FRET responses between donor, FAM, and acceptor (TAMRA) were monitored concerning increasing glucose concentrations for glucose aptamers and scrambled control. (c) The FRET ratio images of WT Arabidopsis leaf cells and atsweet[11;12] mutant leaf cells infiltrated by SS-HS/SCR and SS-HS/GluS. Scale bar, 50 μm. (d) Quantification of the FRET ratio images of WT Arabidopsis leaf cells and atsweet[11;12] mutant leaf cells infiltrated by SS-HS/SCR and SS-HS/GluS. Figure adapted with permission from ref. .
Fig. 28
Fig. 28. Salamo-salen-salamo hybrid Mg2+ complex for the fluorescence detection of H2PO4 ions.
Fig. 29
Fig. 29. (a) Fluorescence-based detection mechanism of Zn(ii) and pH using the DACH-fhba sensor through a emission turn-on strategy. (b) Growth of mung bean sprouts. (c) Schematic diagram of the experimental design for fluorescence imaging in plants. (d) Fluorescence images of sprouts in a solution of DACH-fhba (10 μM) with Zn2+/EDTA. (e) Fluorescence images of sprouts after the addition of DACH-fhba (10 μM) followed by different pH buffer solutions. Scale bar = 2500 μm. Figure adapted with permission from ref. .
Fig. 30
Fig. 30. (a) Chemical structure of probe L. (b) Colour changes of probe L observed under UV light upon the addition of Al3+ at different concentrations on filter paper. (c) Top image: Fluorescence of probe L after the addition of various concentrations of Al(ClO4)3 solution (0, 25, 50, 100, and 200 μM), excited by a handheld UV lamp at 345 nm. The blue emission was photographed immediately in the dark. Bottom image: Fluorescence of probe L after the addition of rice extracts treated with various concentrations of Al3+. Figure adapted with permission from ref. .
Fig. 31
Fig. 31. (a) Scheme of the general steps involved in converting albumin into the ethylene-detecting AEP probe. The chemical structures of the DEAC–Ru complex, DABCYL quencher, and RuQ are shown. (b) Illustration of the pathway leading to the pathogen-associated molecular pattern (PAMP)-triggered immunity (PTI) and subsequent ethylene production. A list of A. thaliana plants used in this experiment is also shown. (c) Summary of the fluorescence measurements under the various experimental conditions studied. Fluorescence and brightfield imaging (×40 magnification) of epidermal peels treated with AEP (100 μM) for wild-type Col-0 are presented. Figure adapted with permission from ref. .
Fig. 32
Fig. 32. (a) FLIPglu-D13 cassette containing linearly fused eCFP-mglB-eYFP genes. The size of each gene, restriction sites, and transcription start and stop are indicated. (b) Schematic working principle of the glucose-sensitive FLIP nanosensor. (c) Glucose-induced FRET signal changes in the cytosol of leaf epidermal cells. Figure adapted with permission from ref. .
Fig. 33
Fig. 33. (a) Schematic representation of MatryoshCaMP6s sensors, composed of GO-Matryoshka (LSSmOrange sandwiched between the C and N termini of either EGFP, sfGFP, or sfGFP-T78H) inserted between the M13 peptide and calmodulin domain. (b) Schematic representation of a MatryoshCaMP6s sensor based on X-ray crystal structure data. (c) Calcium-affinity titrations (I510nm/I570nm ratio). (d) Average z-stack projections of confocal images showing Arabidopsis lateral root before NaCl (Ca2+ flux trigger) treatment (t0 = 100 s) and after treatment (t1 = 186 s; t2 = 334 s). Figure adapted with permission from ref. .
Fig. 34
Fig. 34. (a) Schematic representation in the fluorescence-response of INV-AuNPs-Om. The images show confocal fluorescence microscopy images of INV-AuNPs-OM before and after incubation with sucrose-containing solution (the image after the addition of sucrose has been adapted and modified for visual representation). The presence of glucose stains the fluorescence of AuNPs in a concentration-dependent manner. (b) (I) Schematic representation of surface functionalisation of QDs with boric acids and their aggregation induced by glucose, which in turn leads to attenuation of their fluorescence; (II) glucose detection in Arabidopsis leaves using the QD fluorescent probe in the presence of TGA-QD and BA-QD (top two rows) and the absence of the nanosensors (bottom two rows). Images were recorded with two Raspberry Pi cameras equipped with bandpass optical filters (BP 480–520 nm and BP 590–660 nm for TGA-QD and BA-QD, respectively). Figure adapted with permission from ref. .
Fig. 35
Fig. 35. (a) (I) Truncated and simplified structure of ss(GT)15-wrapped SWCNT. (II) Temporal changes in 6,5 and 7,6 SWCNT peak intensity in the presence of H2O2 (100 μM). (III) Temporal changes in 6,5 and 7,6 SWCNT peak intensity in the presence of NO (500 μM). (b) (I) Structure and general working principle of HeAptDNA-SWCNT used for the detection of H2O2. (II) NIR intensity changes in response to H2O2 (100 μM) added topically on the leaf surface. Sensor emission quenches upon exposure to H2O2, followed by partial recovery and stabilisation of the luminescence signal in the absence of H2O2. Figure adapted with permission from ref. .
Fig. 36
Fig. 36. (a) Schematic illustration of sensor incorporation into plants through an agar medium enriched with nanosensors. As the soybean seedlings grow in this agar, the plants are challenged with a pathogenic trigger, while polyphenol release in response to this challenge is monitored via NIR imaging. (b) Genistein, and trihydroxypterocarpan (THP) as prominent components of the soybean polyphenol profile quench the fluorescence of PEG-PL-SWCNTs in agar. (c) Visible and NIR image of the soybean seedling (scale bar = 1 cm). (d) NIR response close to the challenged root position (root tissue is overlayed with black; white triangle = position for elicitor induction; red line is the line profile position, scale bar = 1 cm). Figure adapted with permission from ref. .
Fig. 37
Fig. 37. (a) Schematic representation of the external factors that induce ROS, e.g., H2O2, formation in plants. (b) The MOF nanosensor was used to detect H2O2 on plant leaves, stems, and roots. (c) ABTS˙+ generates thermal signals under a NIR laser that are detectable by a thermometer. Figure reproduced with permission from ref. .
Fig. 38
Fig. 38. (a) Illustration of MOF–plant nanobiohybrids for environmental pollutant sensing. (b) Representative photos of fluorescence emissions from MOF–plant nanobiohybrids were taken under a UV lamp (320 nm) as a function of Fe3+ concentration in aqueous solutions. The left columns are images of blank nanobiohybrids, and the right columns are the corresponding images of nanobiohybrids after incubation with Fe3+ for 4 hours: (i) 0.05 μM; (ii) 0.1 μM; (iii) 0.5 μM; (iv) 1 μM; (v) 2 μM; (vi) 5 μM; and (vii) 10 μM. (viii) Their fluorescence emission dose responses were analysed by ImageJ. Figure adapted with permission from ref. .
Fig. 39
Fig. 39. (a) Chemical structure of the polymer and the process of protein grafting onto cationic PNCs. (b) In vivo plant stress imaging by the PNC–roGFP complex sensor in Nicotiana benthamiana, tomato, and maize plants. Fluorescence microscopy images showing the detection of ROS by PNC–roGFP in Nicotiana benthamiana leaves. Figure adapted with permission from ref. .
Fig. 40
Fig. 40. (a) Real-time sensing of NAA and 2,4-D uptake in hydroponically grown pak choi and rice plants using SWCNT nanosensors. (b) Chemical structures of the cationic polymer series, comprising (i) a polyfluorene (PF)-based A–B copolymer backbone and (ii) poly(4-vinylpyridine) (PVP) and poly(N-vinylimidazole) (PVI) backbones. (c) Chemical structures and abbreviations of the screened plant hormones. (d) In vitro screening results of SWCNTs against plant hormone analytes for: (i), S1; (ii), S2; (iii), S3; (iv), S4; (v), S5; and (vi), S6. Figure adapted with permission from ref. .
Fig. 41
Fig. 41. (a) Schematic representation of the working principle for the detection of miRNA. (b) Schematic representation of the optical setup used for the SERS-based miRNA in plants. Figure adapted with permission from ref. .
Fig. 42
Fig. 42. (a) SERS-based detection method of thiabendazole on tomato plant leaves. (b) Thiabendazole-dependent SERS spectra recorded on tomato plant leaves. Figure adapted with permission from ref. .
Fig. 43
Fig. 43. (a) SERS signals of different pesticides can be used for their multiplex identification and quantitative detection in plant leaves using ZnO@Co3O4@Ag NPs. (b) SERS spectra of (I) thiram, (II) triazophos, and (III) fonofos on tea leaves using ZnO@Co3O4@Ag NPs as SERS-active components. Corresponding linear regression curves (IV–VI). Figure adapted with permission from ref. .
Fig. 44
Fig. 44. Schematic illustration of the SERS-based detection of H2O2 by AgDeNPs@MHQ in Oxalis corniculata leaves subjected to abiotic stresses, such as heat and mechanical damage. Figure reproduced with permission from ref. .
Fig. 45
Fig. 45. (a) Schematic representation of the formation of Nafion nanochannels on the surface of the microelectrodes. The pores of the nanochannels were filled with Pt nanoparticles in a second step by an electrodeposition process. (b) (I) Amperometric response curves of platinum deposited microelectrodes (black cure) and NPts/CFMDE (red and blue curves) to a series of increases of H2O2 concentration in a stirred deaerated PBS solution (pH 7.4). (II) The calibration curve for H2O2 solution over the concentration range from 10 to 100 nM, and the amperometric response to 10 nM H2O2 is magnified in the inset. Figure adapted with permission from ref. .
Fig. 46
Fig. 46. (a) Schematic representation of the soft and wearable electrochemical sensor for the chemiresistive detection of VOCs. The gold nanoparticles deposited on the surface of the reduced graphene oxide layer, which can be functionalised with various ligands, enabled hydrogen bond-assisted detection of VOCs. (b) Photograph of the location of the wearable sensor and the mechanical damage site. (c) Response curves of the 5-channel sensor array after a mechanical cut on the leaf. Figure adapted with permission from ref. .
Fig. 47
Fig. 47. (a) Cr(TA)2 and Fe(TA)2 nanoparticles. Shown are secondary building unit clusters of M(TA)2, M = Fe or Cr and the idealised representation of Cr/Fe(TA)2 pore structure based on the bulk crystalline structure. (b) Representation of Cr(TA)2 pores before (left) and after (right) oxidation-induced anion intercalation. (c) Sensing of ClO4 anions using a Cr(TA)2 nanoparticle film in aqueous solution by CV measurements and (d) the variation of E1/2 for the intercalation redox feature during titrations of KClO4 into a 0.1 M KOTf aqueous electrolyte solution. Figure adapted with permission from ref. .
Fig. 48
Fig. 48. (a) 3D-rendering of βCD top and side view. Adapted with permission from Martin Chaplin (website: https://www.water.lsbu.ac.uk) chemical structures of the fungicides (b) imazilil and (c) iprodione.
Fig. 49
Fig. 49. (a) Chemical structures of the plant auxin gibberellic acid (GA3), γCD and 2-hydropxpropyl-βCD (HP-βCD). (b) Schematic representation of the host–guest inclusion complex formation between CDs and GA3. (c) Schematic representation CDs⊃GA3 promoted root growth of cucumber seedlings (C. sativus). The plant seeds were put on filter paper in the Petri dishes filled with 5.0 mL diluents of different treatment solutions and were grown in a growth chamber for 5 days. Figure adapted with permission from ref. .
Fig. 50
Fig. 50. (a) The chemical structure of the herbicide bensulfuron-methyl forms inclusion complexes in water with βCD or (2-hydroxypropyl)-βCD, increasing its water solubility. (b) When applied to Eclipta prostrata by spraying onto the sprouts, the βCD-based formulations of BSM are more effective herbicides, as they inhibit growth more effectively than free BSM.
Fig. 51
Fig. 51. (a) The chemical structure of DPU forms an inclusion complex with βCD or HP-βCD in water. When applied to the growth medium for growing bean sprouts, the cyclodextrin formulations of DPU yielded thicker stems in the sprouts, indicating that the bioavailability of this cytokinin increased significantly. (b) Images of broccoli sprouts after 7 days of treatment. Figure adapted with permission from ref. .
Fig. 52
Fig. 52. Chemical structure of MNS and schematic representation of its complex formation with HP-βCD. The presumed structure of the resulting host–guest complex and its assembly into nanometre-sized aggregates is also shown. Figure adapted with permission from ref. .
Fig. 53
Fig. 53. (a) Schematic representation of the formation of CD⊃F6-based supramolecular assemblies in water. (b) CD⊃F6-based supramolecular aggregates serve as T3SS inhibitors and are antifungal agents with excellent absorption properties, due to the presence of the cyclodextrin host through the leaves to control microbial infections in plants. Figure adapted with permission from ref. .
Fig. 54
Fig. 54. (a) Chemical structures of the arylazopyrazole-modified hyaluronic acid polymer (HA-AAP) and the guanidine-functionalised βCD (guano-CD). (b) Mixing HA-AAP with guano-CD leads to the formation of a supramolecular HA-AAP-guano-CD assembly, which, when mixed with LAPONITE® clays in water, forms a hydrogel through electrostatic attraction between the positively charged guanidine residues and the negatively charged clays. After drying the hydrogel, it can be loaded with GA3 by soaking the dried gel in a GA3-containing solution. Upon light irradiation, the arylazopyrazole moiety in HA-AAP switches from its E to Z isomer, which has a lower affinity for guano-CD, leading to hydrogel disassembly as the supramolecular crosslinking is disrupted. As the hydrogel degrades, GA3 is released and becomes bioavailable to plants. (c) Photographs of Chinese cabbage grown in media containing the GA3-loaded supramolecular hydrogel, with or without light irradiation. Figure adapted with permission from ref. .
Fig. 55
Fig. 55. (a) Chemical structure of the antibacterial agent (E)-3,3′-((diazene-1,2-diylbis(4,1-phenylene))bis(oxy))bis(1-((3-methoxybenzyl)(methyl)amino)propan-2-ol) (3a). In its E-isomeric form, it binds to βCD, forming a βCD⊃3a host–guest inclusion complex, which in solution is hypothesised to form larger supramolecular aggregates. Upon light irradiation, the diazobenzene moiety within 3a switches to its Z-isomeric form, which has a lower affinity for βCD, resulting in the disassembly of the supramolecular complex. (b) Photographs of rice challenged with bacterial blight and subjected to βCD⊃3a, βCD, or the control (absence of 3a, βCD, or βCD⊃3a). Figure adapted with permission from ref. .
Fig. 56
Fig. 56. Schematic depiction of constructing fungicidal supramolecular nanovesicles (AoH25@βCD) to improve droplet wetting and deposition as well as efficiently inhibit fungal mitochondrial SDH. Figure reproduced with permission from ref. .
Fig. 57
Fig. 57. (a) Chemical structures of representative commercial adamantyl-based drugs, the molecular design strategy for adamantane-functionalised 1,3,4-oxadiazoles (guest molecules), and a schematic representation of spheroidal architectures formed through βCD-mediated host–guest interactions. (b) Protective and curative efficacies of compound III18, βCD, III18@βCD, and TC against rice bacterial blight at an effective III18 concentration of 200 μg mL−1. Figure adapted with permission from ref. .
Fig. 58
Fig. 58. Chemical structure of AdA8, its supramolecular complexation with β-cyclodextrin, and schematic representation of the subsequent self-assembly into hollow nanoparticles. Also depicted is the spray-based application of the nanoformulation, which enhances leaf surface wettability, promotes effective biofilm disruption, and leads to improved overall bactericidal activity. Figure reproduced with permission from ref. .
Fig. 59
Fig. 59. Schematic illustration of the fabrication of effective supramolecular bactericidal materials with enhanced bioavailability for controlling plant-associated biofilm infections. Reproduced with permission from ref. .
Fig. 60
Fig. 60. (a) Chemical structures of APO and DiS-NH2, along with their various protonation states. (b) Images of wheat coleoptiles after 24 hours of treatment with APO (left) or APO–CB7 (right). Figure adapted with permission from ref. .
Fig. 61
Fig. 61. (a) Chemical structures of carbazole-functionalised QA salts (guest molecules) and a schematic representation of the stimuli-responsive host–guest supramolecular system employed for phytopathogen management. (b) In vivo trials against rice bacterial blight were conducted using CB7, AD, AD@CB7, and A1@CB7. BT and TC served as positive controls; CK as positive control. Figure adapted with permission from ref. .
Fig. 62
Fig. 62. (a) Schematic representation of the complexation process involving CB8, PQ, and trans-G. The illustration depicts CB8-mediated binding with PQ as the primary guest and trans-G as the secondary guest. It also highlights the reversible, photo-induced transition between the complexation of the trans-G isomer and the decomplexation triggered by the cis-G isomer. (b) PQ-loaded vesicles release PQ upon light irradiation. (c) Weed control efficacy of free PQ and PQ-loaded photo-responsive vesicles. Foliar treatment was conducted using control (water), free PQ, and PQ-loaded vesicles under simulated sunlight irradiation, with an additional condition of PQ-loaded vesicles exposed to simulated sunlight without UV light, all at a single dose concentration of 2 mg mL−1. Figure adapted with permission from ref. .
Fig. 63
Fig. 63. Schematic illustration depicts the assembly of a three-component supramolecular nanobiscuit system (composed of NI6R@CB7@βCD), engineered as a biosafe, multifunctional bactericidal material for improving foliar droplet deposition, eliminating persistent biofilms, and effectively controlling bacterial diseases. Figure adapted with permission from ref. .
Fig. 64
Fig. 64. Schematic depiction of potent multifunctional supramolecular bactericidal materials derived from natural products as biofilm disintegrators with superior foliar affinity for the effective management of bacterial canker in tomato. Figure adapted with permission from ref. .
Fig. 65
Fig. 65. Schematic representation of the self-assembly of SCX4 with Cht to form nanometre-sized vesicles capable of loading paraquat (PQ). The resulting supramolecular formulation enhances foliar deposition and delivery efficiency of the PQ pesticide. Figure adapted with permission from ref. .
Fig. 66
Fig. 66. (a) Transmission electron microscopy (TEM) image of MSPs used to construct gated and SA-loaded mesoporous silica particles. (b) The presence of GSH enables the gatekeeper to open through a disulfide exchange reaction. Once the gatekeeper unit (C10-aliphatic chain) is removed, the salicylic acid is free to diffuse out from the nanoparticle's pore. (c) The cumulative amount of SA released from MSN-SS-C10 under different GSH concentrations. (d) Representative photos of Arabidopsis thaliana seedlings in pots after salicylic acid-loaded MSN-SS-C10 nanoparticle treatment at day 7. (e) “Housekeeping” gene actin and defence gene PR-1 expression in Arabidopsis thaliana following MSN, SA, and SA@MSN-SS-C10 treatment on days 3, 5, and 7. M represents HyperLadder IV (bioline), and −Ve represents the blank channel. Actin is in the top row, and PR-1 is in the bottom row. Figure adapted with permission from ref. .
Fig. 67
Fig. 67. (a) TEM image of Pro@Fe-MSNs/TA. (b) The antifungal activity was tested in vivo using three-week-old tomato leaves, which were sprayed with Pro@Fe-MSNs/TA and Pro–TC at a Pro concentration of 1 μg mL−1. Rhizoctonia solani, a fungus, secretes organic acids during growth and infection that acidify plant tissues, creating favourable conditions for its reproduction. Simultaneously, the disintegration of the Fe–O coordination bond within the MSPs leads to their disintegration. (c) Images of tomato leaves treated with deionised water (blank), Pro, or Pro@Fe-MSNs/TA in fungicidal activity tests and (d) lesion diameters measured at 7 days after the fungi inoculation. Figure adapted with permission from ref. .
Fig. 68
Fig. 68. (a) Scheme for the amylase-triggered release of AVM from AVM-HMS9 by the degradation of αCD caps. (b) TEM image of αCD capped HMS. (c) Cumulative AVM release profiles from AVM-CRF in the presence (red line) and absence (black line) of amylase. Figure adapted with permission from ref. .
Fig. 69
Fig. 69. (a) Scheme of chloroplast targeting quantum dots (Chl-QDs) containing βCD and chloroplast targeting peptide (Chl) that is based on a (b) truncated Rubisco small subunit biorecognition motif (RbcS), which guides protein precursors to chloroplast outer membranes. (c) TEM image of QDs lacking the targeting peptide. (d) Quantum dots coated with a chloroplast guiding peptide (in blue) and a β-CD molecular basket (in magenta) enable loading of methyl viologen (MV-Chl-QD) or ascorbic acid (Asc-Chl-QD) and targeted modification of the redox status of chloroplasts in planta. The RbcS targeting peptide is designed to bind to the translocon supercomplex on the chloroplast outer membrane (TOC). Figure adapted with permission from ref. .
Fig. 70
Fig. 70. (a) Sucrose-coated QDs (sucQDs) and βCD-carbon dots (suc-β-CDs) are delivered to the phloem via foliar application. These nanomaterials are guided through leaf tissues by binding to sucrose transporters in phloem vessels, bypassing cell barriers and penetrating phloem cells by disrupting lipid membranes. (b) (i) 3D confocal microscopy images of leaves near the QD or sucQD foliar application area in intact live plants show that sucQD (in green) was localised in wheat parallel leaf veins between mesophyll cells containing chloroplasts (in magenta). (ii) Representative images showing the high colocalisation of sucQD with carboxyfluorescein (CF) fluorescent dye that labels phloem cells (in blue). Scale bar = 30 μm. (iii) In planta confocal fluorescence microscopy images of β-GdCDs and suc-β-GdCDs in wheat leaf vasculature. The suc-β-GdCD were localised in the vasculature 2.2 times higher than the uncoated GdCD. Scale bar = 30 μm. (c) Real-time imaging of QDs within the phloem of wheat leaves in planta using a customised inverted epifluorescence microscope. Scale bar = 100 μm. (d) The uptake and translocation of QDs and sucQD to various wheat plant organs were analyzed using ICP-MS (targeting the Cd element in the QD core). Shown are the sampled areas, including exposed and trace leaf regions, stems, and roots. After 24 hours of nanoparticle exposure, the fraction of Cd detected in wheat plants reveals significantly greater translocation of sucQD to all sampled areas, including roots, compared to unmodified QDs. Figure adapted with permission from ref. .
Fig. 71
Fig. 71. (a) TEM image of RCNMV loaded with Abm (PVNAbm). (b) Schematic representation of PVNAbn and the chemical structures of Abamectins. (c) PVNAbm enhances the soil mobility and controlled release of Abm, resulting in an expanded zone of protection against Meloidogyne hapla root-knot nematodes. Figure adapted with permission from ref. .
Fig. 72
Fig. 72. (a) Encapsulation of small molecules (such as the active ingredient, Cy5, or IVN occurs during the thermal shape transition of TMGMV into SNPs, with transparency indicating the incorporation of the small molecules within the SNPs). (b) SEM image of IVN-loaded TMGMV nanoparticles. (c) IVN-loaded nanoparticles have improved mobility and slightly higher soil retention compared to TMGMV rods. Ivermectin delivery to Caenorhabditis elegans was confirmed after the SNP formulations passed through the soil. Figure adapted with permission from ref. .
Fig. 73
Fig. 73. (a) Schematic representation of the fabrication process for the multi-stimuli-responsive supramolecular nano platform (GA-loaded CLT6@PCN-Q), utilising a CLT6-capped MOF and their use as plant growth regulators. (b) The release profiles of RhB from RhB-loaded MOF-based nanoparticles in response to external stimuli, such as (i) pH, (ii) temperature, and (iii) SPM. (c) Germination curves of wheat treated by CLT6@PCN-Q, GA, and GA-loaded CLT6@PCN-Q. Figure adapted with permission from ref. .
Fig. 74
Fig. 74. (a) General chemical structure of P[BiBEM-g-(PAA-b-PNIPAm)] polymer bottlebrushes. (b) Atomic force microscope height images of SBB50 and LBB50. (c) Schematic showing the spermidine (Spd) loading into the polymer bottlebrushes and (d) high temperature-induced Spd release. (e) Uptake and transport of Gd3+-loaded bottlebrushes in tomato plants after foliar application of 20 μL of a 1 g L−1 suspension in 0.1 v/v% Silwet L-77 for (i) SBB50 and (ii) LBB50. Amounts of Gd detected in the different plant tissues are expressed by both the fraction of Gd mass applied and total Gd mass in each plant compartment (number of experiments per sample = 5). Figure reproduced with permission from ref. .
Fig. 75
Fig. 75. (a) Gold nanoparticle-capped mesoporous silica nanoparticles (MSN) loaded with β-oestradiol can adsorb plasmid DNA on their surface, facilitating the co-delivery of both cargos into plant cells. Once the particles cross the cell membrane, the plasmid DNA is released. In the reductive environment inside the cell, disulfide bonds linking the gold caps to the mesoporous silica are reduced, leading to the disassembly of the caps from the particle surface and enabling the release of the plant hormone β-oestradiol. (b) Fluorescent foci per transgenic cotyledon grown with (grey bar) or without (black bar) DTT after bombardment with MSNs. (c) (i) Bright field and (ii) UV light/GFP filter (scale bar: 0.5 mm) images of non-transgenic plants in DTT-medium and bombarded by DNA-coated type-IV MSNs. Figure reproduced with permission from ref. .
Fig. 76
Fig. 76. (a) Schematic representation of organically functionalised mesoporous silica nanoparticles. (b) TEM images of TMAPS functionalised FITC-mesoporous silica nanoparticles (TMAPS/F-MSNs). (c) Confocal microscopy of Arabidopsis root cells, i.e., endodermal cells, treated with DNA–MSN complexes (1 : 100 ratio). Gene expression (mCherry protein; red). (d) TEM of immunogold-labelled mCherry protein in root cells after incubation with DNA–MSN complexes. Red arrows show the gold-labelled mCherry proteins. Presence of TMAPS/F-MSNs (black arrow) and mCherry protein (red arrows) in the same cell (i) and (ii). Scale bars are 200 nm. Cp, cytoplasm; M, mitochondrion; V, vacuole; G, Golgi apparatus. (e) Possible routes and fates of TMAPS/F-MSNs after internalisation into the Arabidopsis root cell. Once passed through the cell wall, TMAPS/F-MSNs may be internalised by endocytosis (A) or penetrate the plasma membrane (B). The DNA-loaded TMAPS/F-MSN complex internalised into the plant cell (C) could then approach the nucleus. Figure reproduced with permission from ref. .
Fig. 77
Fig. 77. (a) Schematic representation of the glutathione-reducible peptide (BPCH7) and the proposed mechanism for intracellular delivery and subsequent pDNA release. BPCH7 (KKLFKKILKYLHHCRGHTVHSHHHCIR) forms a stable complex with plasmid DNA in the extracellular environment. Once the complex is delivered into the plant cell via endocytosis, the reductive intracellular environment, primarily mediated by glutathione (GSH), triggers the cleavage of the intramolecular disulfide bond within the cyclic CH7 domain. This cleavage leads to the dissociation of the complex and the subsequent release of pDNA, allowing its expression in the cell nucleus. (b) Cartoon of a leaf indicating locations of the adaxial and abaxial epidermis as well as palisade and spongy mesophyll cells. (c) Confocal images tKEN from vacuolar compartmentation of BCECF-AM in wild-type A. thaliana leaf epidermal cells. Scale bars indicate 10 μm. Figure reproduced with permission from ref. .
Fig. 78
Fig. 78. (a) Schematic representation of CTP/CPP-MC-mediated transfection of chloroplasts with reporter genes (GFP or Renilla luciferase (Rluc)) in plants pretreated with ZIL. (b) CLSM images showing GFP expression in epidermal cells in ZIL-untreated and ZIL-pretreated A. thaliana cotyledons 24 h after transfection with CTP/CPP-MC or controls (naked pDNA or CTP/CPP-MC containing pDNA for nucleus transfection (P35S-GFP-Tnos)). Scale bars = 40 μm. (c) Boxplot showing the relative transfection efficiency of each system, based on Rluc expression levels in ZIL-pretreated A. thaliana seedlings 24 hours post-infiltration. Statistical significance is evaluated in comparison to the control (CTP/CPP-MC, ZIL). Figure reproduced with permission from ref. .
Fig. 79
Fig. 79. (a) Chemical structure of chitosan-complexed SWCNT. (b) The pDNA–SWCNT complexes enter the leaf mesophyll through the stomatal pores, passing through the plant cell walls, plasma membranes, and ultimately the chloroplast bilayers. The negatively charged pDNA is condensed onto the positively charged surface of the chitosan-complexed SWNTs through electrostatic interactions. (c) Fluorescence confocal micrographs of mesophyll cells from tobacco leaves infiltrated with pDNA–SWNTs (1 : 3 ratio, 1.5 mg L−1 of SWNTs) were captured 2 to 3 days post-infiltration. Figure reproduced with permission from ref. .
Fig. 80
Fig. 80. (a) Schematic representation of PEI-modified carboxylated CNTs. (b) Schematic depicting DNA–CNT trafficking in plant cells and subsequent gene expression (dotted lines represent trafficking steps and the rigid lines represent gene expression steps). PM, plasma membrane. (c) Representative confocal microscopy images of pDNA–PEI–CNT-infiltrated mature Nb leaves imaged at days 3 and 10. (d) (i) Quantitative fluorescence intensity analysis of confocal images at 3 and 10 days post-infiltration. (ii) qPCR analysis of GFP mRNA expression levels at day 3 and day 10 in pDNA–PEI–CNT-treated Nb leaves. Figure reproduced with permission from ref. .
Fig. 81
Fig. 81. (a) Targeted carbon nanostructures for chloroplast bioengineering were developed to explore their effects on plant cell and molecular biology. Nanomaterials were synthesised for chloroplast-targeted chemical delivery (CDs) and gene delivery (SWCNTs). These carbon nanostructures were functionalised with a guiding peptide that specifically binds to the translocon of the outer chloroplast membrane (TOC) proteins. (b) The impact of targeted carbon nanostructures on leaf cell and molecular biology was assessed by studying the effects on plant cell and chloroplast membrane integrity, the damage to whole plant cell and isolated chloroplast DNA, the generation of ROS, and photosynthesis. Figure adapted with permission from ref. .
Fig. 82
Fig. 82. (a) Virus-like nanocarriers facilitated DNA delivery in Arabidopsis plant cells. Negatively charged TMGMVs or inactivated TMGMVs (iTMGMVs) were coated with poly(allylamine) hydrochloride (PAH) to impart a positive charge, forming TMGMV-PAH. These were electrostatically loaded with either a DNA oligo (GT15, 30 bp ssDNA) linked to a Cy3 dye (TMGMV-PAH-GT15-Cy3) or pDNA encoding GFP. Nanocarriers and DNA spontaneously entered plant cells through energy-independent mechanisms. iTMGMV-PAH successfully mediated pDNA delivery and expression in Arabidopsis epidermal cells. (b) Confocal microscopy images of Arabidopsis leaves monitoring the pDNA delivery (encoding for GFP) and expression mediated by iTMGMV-PAH-pDNA. Scale bars 30 μm (c) (i) Fluorescence intensity indicating GFP expression in leaf epidermal cells infiltrated with iTMGMV-PAH-pDNA. (ii) RT-qPCR analysis of GFP mRNA expression levels 2 days post iTMGMV-PAH-pDNA infiltration in Arabidopsis leaves. Figure adapted with permission from ref. .
Fig. 83
Fig. 83. (a) The DNA nanostructures were synthesised from four ssDNA sequences to form tetrahedrons and HT monomers, with 1D nanostrings produced by HT monomer polymerisation using an initiator strand. Cargo attachment sites were located at the apex of the tetrahedron, along the nanostring, and at the side (HT-s) or centre (HT-c) of HT structures. AFM images showed streptavidin-bound biotinylated HT monomers and nanostrings with siRNA cargo. Cy3 or siRNA-loaded nanostructures were infiltrated into transgenic mGFP5 Nb plant leaves for further studies. Scale bars, 100 nm. (b) Infiltration of siRNA-linked DNA nanostructures into mGFP5 Nb leaves. (c) Representative confocal images of leaves infiltrated with siRNA nanostructures 3 d post infiltration, with nontreated control leaves. Scale bars, 100 μm. (d) Fluorescence intensity analysis of confocal images. (e) Representative western blot gel of GFP extracted from nanostructure-treated leaves 2 d post infiltration. (f) Representative western blot of GFP extracted from leaves treated with siRNA linked to tetrahedron or HT-s 7 d post-infiltration. Figure adapted with permission from ref. .
Fig. 84
Fig. 84. (a) A schematic representation of the synthesis of PEI-AuNCs (utilising PEI with average molecular weights of 800, 2.5k, and 25 kg mol−1), followed by siRNA loading via electrostatic adsorption and subsequent infiltration-based delivery into mature mGFP5 Nb plant leaves for gene silencing. (b) siRNA delivered by 800-, 2.5k-, and 25k-PEI-AuNCs can induce efficacious gene silencing as shown by qPCR to quantify GFP mRNA fold changes 1-day post-infiltration with water (control), free siRNA, positive control of siRNA mixed with free PEI polymers (800, 2.5k, and 25k), and siRNA-loaded PEI-AuNCs. (c) Representative western blot gel (top image) and statistical analysis of GFP proteins extracted from leaves treated with water (control), free siRNA, or siRNA-loaded PEI-AuNCs 3 days post-infiltration. Figure adapted with permission from ref. .
Fig. 85
Fig. 85. (a) The BioClay experiment was conducted by spraying the plants with LDH, CMV-dsRNA and CMV-BioClay (CMV-dsRNA–LDH). The inset shows the TEM image of LDH nanoclays and a schematic representation of BioClay. (b) (i) Images showing the extent of necrotic lesions on N. tabacum cv. xanthi leaves challenged with PMMoV 5 days post-spray treatment and, (ii) 20 days post-treatment. Figure adapted with permission from ref. .
Fig. 86
Fig. 86. (a) Schematic representation of ZIF-8 building blocks and their structure (H atoms are omitted for clarity). The yellow sphere represents the void volume within the ZIF-8 structure. (b) Schematic representation of ZIF-8 nanoparticle-mediated gene delivery into Nicotiana benthamiana leaves and Arabidopsis thaliana roots. (c) Confocal images of Nicotiana benthamiana leaves and Arabidopsis thaliana roots post-infiltration. The representative images display the cellular uptake of pure ZIF-8 NPs, pure FAM-labelled DNA, and FAM-labelled DNA-loaded ZIF-8 NPs in Nicotiana benthamiana leaf cells and Arabidopsis thaliana root cells. Scale bar: 20 μm. Figure adapted with permission from ref. .
Fig. 87
Fig. 87. (a) Schematic representation of the formation of Gu+–siRNA nanoparticles via electrostatic interactions between guanidinium (Gu+)-containing disulfide molecules and the phosphate groups (PO4) of siRNA. (b) TEM image of Gu+–siRNA NPs. (c) Illustration of GD1 and EIL1/2 gene functions in rice seed germination and salt stress response. (d) Gu+–siRNA-GD1 NPs inhibit rice seed germination. (e) Relative expression levels of GD1 following treatment. Gu+–siRNA-EIL1/2 NPs promote coleoptile elongation via long-distance transport from root to shoot. Figure reproduced with permission from ref. .
None
Maria Vittoria Balli
None
Frank Biedermann
None
Luca Prodi
None
Pierre Picchetti

Similar articles

References

    1. Sadigov R. Sci. World J. 2022;2022:8110229. - PMC - PubMed
    1. Erisman J. W. Sutton M. A. Galloway J. Klimont Z. Winiwarter W. Nat. Geosci. 2008;1:636–639.
    1. Whalen J. M. Matlin S. A. Holme T. A. Stewart J. J. Mahaffy P. G. ACS Sustainable Chem. Eng. 2022;10:12933–12947.
    1. Sassenrath G. F. Heilman P. Luschei E. Bennett G. L. Fitzgerald G. Klesius P. Tracy W. Williford J. R. Zimba P. V. Renewable Agric. Food Syst. 2008;23:285–295.
    1. Shan-e-Ali Zaidi S. Vanderschuren H. Qaim M. Mahfouz M. M. Kohli A. Mansoor S. Tester M. Science. 2019;363:1390–1391. - PubMed

LinkOut - more resources