Identification and Validation of a Prognostic Model Based on Tumour Necrosis Factor-Related mRNAs for Kidney Renal Clear Cell Carcinoma
- PMID: 40673609
- PMCID: PMC12268967
- DOI: 10.1111/jcmm.70657
Identification and Validation of a Prognostic Model Based on Tumour Necrosis Factor-Related mRNAs for Kidney Renal Clear Cell Carcinoma
Abstract
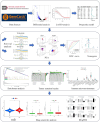
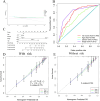
Tumour necrosis factor (TNF) plays a critical role in tumour progression, but the specific involvement of mRNA in this process, particularly in kidney renal clear cell carcinoma (KIRC) remains insufficiently understood. Our study aims to develop a TNF-related mRNA (TRmRNA) model to predict prognosis and inform treatment strategies in KIRC. KIRC expression data from The Cancer Genome Atlas (TCGA) and TNF-related genes (TRGs) from the Genecards database were used to construct and validate a TRmRNA prognostic model. A nomogram integrating clinical features with the risk model was also developed to enhance prognostic accuracy. Enrichment analysis, drug sensitivity analysis and RT-qPCR validation were performed to further explore the biological mechanisms and clinical applicability of the model. A prognostic signature consisting of nine TRmRNAs was identified. Kaplan-Meier analysis showed that the high-risk (HRK) group had significantly shorter overall survival (OS) compared to the low-risk (LRG) group (p < 0.001). The nomogram, incorporating the risk model, yielded an area under the curve (AUC) of 0.766, indicating robust prognostic accuracy. Enrichment analysis identified solute sodium symporter and proximal tubule transport pathways enriched in the LRG group, whereas the HRK group exhibited enrichment in CD22-mediated BCR regulation and immunoglobulin complex pathways. The HRK group also showed a higher tumour mutational burden (TMB), correlating with a poorer prognosis. RT-qPCR confirmed the differential expression of mRNAs in KIRC cells. The TRmRNA-based prognostic model holds significant promise for predicting patient outcomes and guiding personalised treatment strategies in KIRC.
Keywords: kidney clear cell carcinoma; messenger RNA; prognostic model; tumour necrosis factor.
© 2025 The Author(s). Journal of Cellular and Molecular Medicine published by Foundation for Cellular and Molecular Medicine and John Wiley & Sons Ltd.
Conflict of interest statement
The authors declare no conflicts of interest.
Figures


Similar articles
-
Unveiling ammonia-induced cell death: a new frontier in clear cell renal cell carcinoma prognosis.Front Immunol. 2025 Jul 31;16:1636977. doi: 10.3389/fimmu.2025.1636977. eCollection 2025. Front Immunol. 2025. PMID: 40821775 Free PMC article.
-
Prognostic and therapeutic relevance of IL2RG-related LncRNAs in clear cell renal cell carcinoma.Sci Rep. 2025 Aug 13;15(1):29651. doi: 10.1038/s41598-025-15439-1. Sci Rep. 2025. PMID: 40804289 Free PMC article.
-
Construction of a risk and prognostic model for migrasome-associated lncRNAs in renal cell carcinoma.Sci Rep. 2025 Jul 23;15(1):26760. doi: 10.1038/s41598-025-10630-w. Sci Rep. 2025. PMID: 40702098 Free PMC article.
-
Impact of residual disease as a prognostic factor for survival in women with advanced epithelial ovarian cancer after primary surgery.Cochrane Database Syst Rev. 2022 Sep 26;9(9):CD015048. doi: 10.1002/14651858.CD015048.pub2. Cochrane Database Syst Rev. 2022. PMID: 36161421 Free PMC article.
-
Cost-effectiveness of using prognostic information to select women with breast cancer for adjuvant systemic therapy.Health Technol Assess. 2006 Sep;10(34):iii-iv, ix-xi, 1-204. doi: 10.3310/hta10340. Health Technol Assess. 2006. PMID: 16959170
References
-
- Siegel R. L., Giaquinto A. N., and Jemal A., “Cancer Statistics, 2024,” CA: A Cancer Journal for Clinicians 74, no. 1 (2024): 12–49. - PubMed
-
- Motzer R. J., Jonasch E., Agarwal N., et al., “NCCN Guidelines Insights: Kidney Cancer, Version 2.2024,” Journal of the National Comprehensive Cancer Network 22, no. 1 (2024): 4–16. - PubMed
-
- Klatte T., Rossi S. H., and Stewart G. D., “Prognostic Factors and Prognostic Models for Renal Cell Carcinoma: A Literature Review,” World Journal of Urology 36, no. 12 (2018): 1943–1952. - PubMed
MeSH terms
Substances
Grants and funding
LinkOut - more resources
Full Text Sources
Medical
Miscellaneous

