. 2025 Jul;15(7):e70419.
doi: 10.1002/ctm2.70419.

Itaconate suppresses neonatal intestinal inflammation via metabolic reprogramming of M1 macrophage

Affiliations

Itaconate suppresses neonatal intestinal inflammation via metabolic reprogramming of M1 macrophage

Shuchen Huangfu et al. Clin Transl Med. 2025 Jul.

Abstract

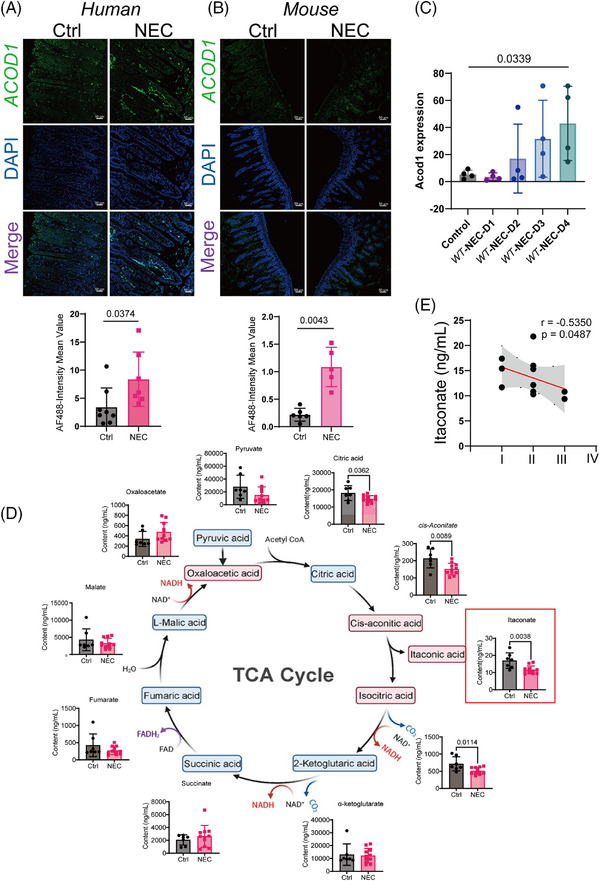
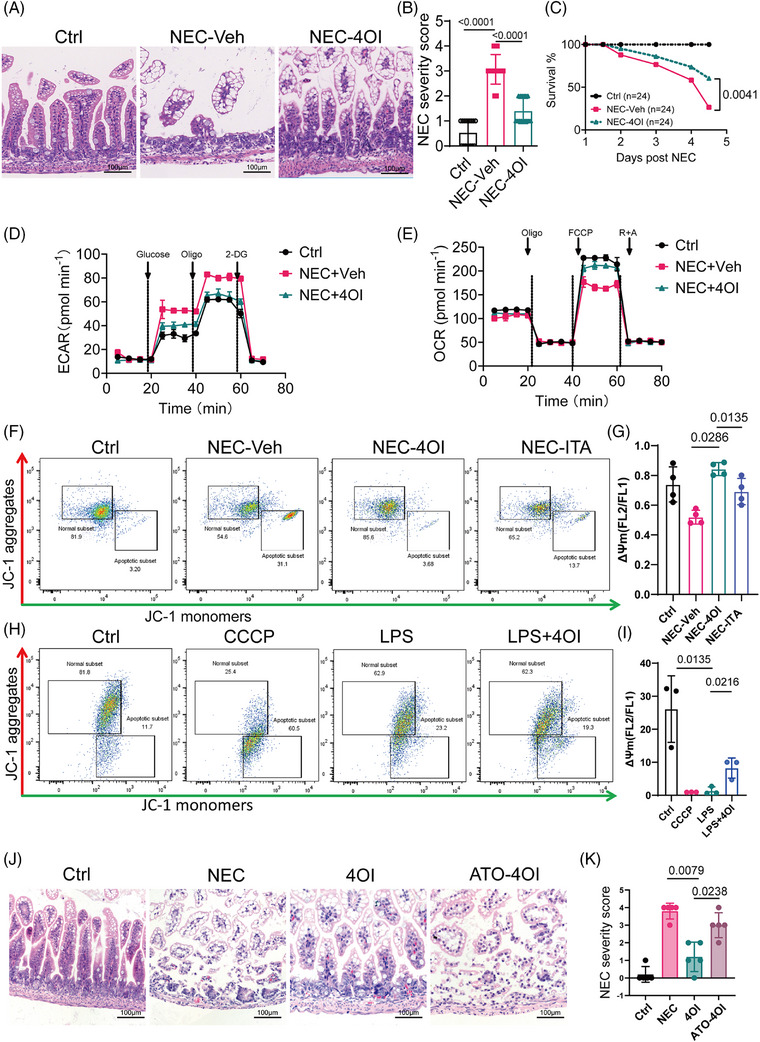
Background: Necrotizing enterocolitis (NEC) is a rapidly progressive and severe gastrointestinal disorder in neonates that is marked by an inflammatory cascade initiated by mechanisms that remain incompletely understood, resulting in intestinal necrosis and systemic infections. This study demonstrated that itaconate (ITA) exerts a protective effect in NEC by regulating macrophage reprogramming.

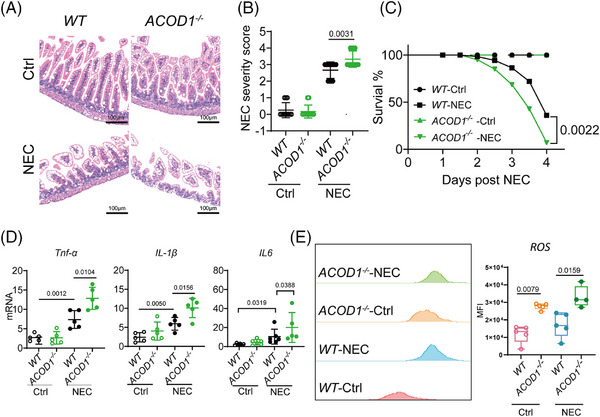
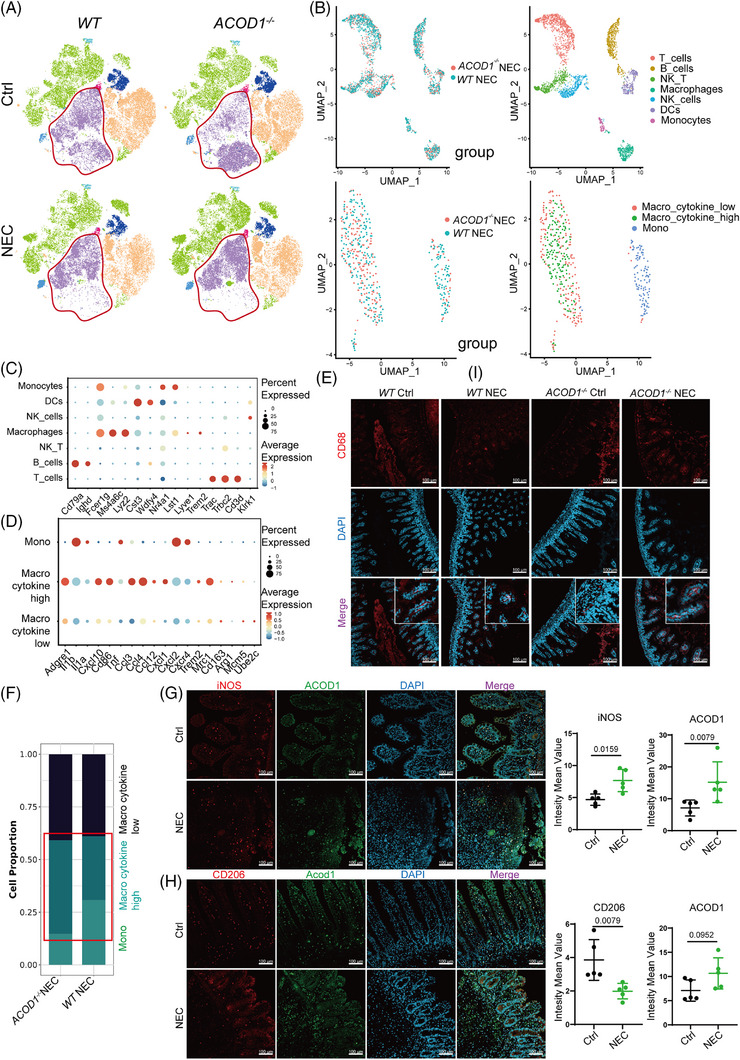
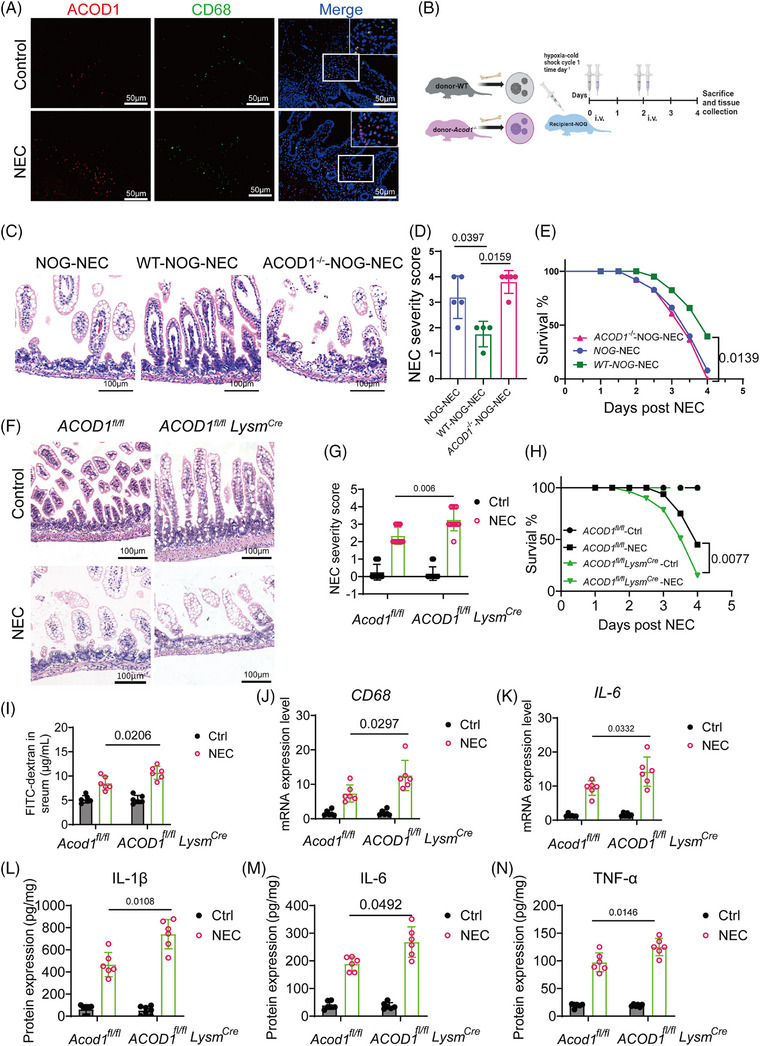
Methods: Changes in ITA expression were investigated using immunofluorescence staining and liquid chromatography-mass spectrometry, and their effect on immune cell differentiation was verified through single-cell sequencing. In vivo experiments were performed using ACOD1-/- and ACOD1fl/flLysMcre NEC mouse models.

Results: We detected changes in ITA expression in clinical NEC samples and confirmed the effect of these changes on immune cell differentiation. In vivo experiments confirmed the therapeutic role of ITA in regulating macrophage differentiation in NEC, and we further investigated the mechanism by which ITA regulates macrophage metabolic reprogramming. The depletion of ITA in NEC correlates with an increased frequency of pro-inflammatory macrophage polarization, thereby exacerbating intestinal inflammatory injury. Importantly, our in vivo experiments revealed that treatment with 4-octyl itaconate (4OI) significantly mitigated intestinal symptoms associated with NEC in murine models. Mechanistic investigations showed that 4OI effectively suppressed M1 macrophage polarization by rescuing mitochondrial function and upregulating oxidative phosphorylation in macrophages.

Conclusions: Our results highlight ITA as a metabolic checkpoint of macrophage differentiation in NEC and suggest the therapeutic efficacy of 4OI in NEC.

Key points: Itaconate alleviates NEC by reprogramming M1 macrophage metabolism ACOD1 deficiency exacerbates NEC severity 4OI maintains intestinal barrier integrity. 4OI rescues NEC by regulating macrophage mitochondrial activity.

Keywords: itaconate; macrophage; metabolic reprogramming; necrotizing enterocolitis; oxidative phosphorylation.


Conflict of interest statement

The authors declare no conflicts of interest.

Figures

FIGURE 1
FIGURE 1
The absence of itaconate (ITA) is present in the development of necrotizing enterocolitis (NEC). (A‐B) Representative confocal images and quantification of fluorescent intensity of ACOD1 immuno‐stained ileal sections of human (n = 8 per group) (A), mouse (n = 5 per group) (B). (C) Expression levels of ACOD1 in mice subjected to varying durations of modelling (n = 4). (D) Relative abundance of TCA cycle metabolites (ITA, isocitrate, α‐ketoglutarate, succinate, malate, pyruvate, citrate, and cis‐aconitate) was measured by metabolomics in control (n = 7) and NEC (n = 11) group. a.u., arbitrary units based on MS peak area, Data are presented as mean ± SEM. Unpaired t test, two‐tailed. (E) Analysis of the correlation between NEC clinical disease staging (BELL Score) and ITA Content, Data are presented as mean ± SEM. Unpaired t‐test, two‐tailed (D). Wilcoxon signed‐rank test, Two tailed (A B C). Pearson's correlation (E). p‐value as shown in Figure.
FIGURE 2
FIGURE 2
ACOD1 deficiency aggravates inflammatory injury in necrotizing enterocolitis (NEC). (A) Representative images of H&E‐stained of the intestinal epithelial tissue in WT mice and ACOD1−/− mice. (B) Severity score and of WT mice and ACOD1−/− mice in NEC, (n = 12 per group). (C) survival curve of WT mice and ACOD1−/− mice in NEC, (n = 20 per group). (D) Quantitative measurement of mRNA levels of inflammatory factors IL‐6, IL‐1β, and TNF‐α, (n = 5 per group). (E) Flow cytometry analysis of ROS levels (left) and quantification of mean fluorescence intensity (MFI) (right) in WT and ACOD1 −/− mice under control and NEC conditions, (n = 5 per group). Data represent mean ± SD, Wilcoxon signed‐rank test, Two‐tailed (B D E). Log‐rank test (C). p‐value as shown in Figure.
FIGURE 3
FIGURE 3
ACOD1 deficiency promotes the proinflammatory polarization of macrophages during necrotizing enterocolitis (NEC). (A) UMAP plot of dimensionality reduction analysis of flow cytometry data for immune cells isolated from intestinal tissue of the WT and ACOD1 −/− mice in the negative control group and NEC group, WT Ctrl (n = 5), WT NEC (n = 6), ACOD1 −/‐ Ctrl (n = 4), ACOD1 −/− NEC (n = 3). Clusters are coloured as in Figure S1C. (B) UMAP plots of immune cells from NEC WT and ACOD1 −/− mice, data from scRNA‐sequencing. (C) The expression of specific marker genes in each kind of immune cells populations was determined. The size of the dots indicates the percentage of cells expressing the gene of interest, while the intensity of the colour indicates expression levels. (D) The expression of M1‐like and M2‐like marker genes in each macrophage subpopulation. The size of the dots and intensity of colours as in B. (E) Representative confocal images of fluorescent intensity of CD68 in intestinal tissues of WT and ACOD1 −/− mice. (F) The proportion of macrophage subpopulations from NEC WT and ACOD1 −/− mice. (G) Representative confocal images of fluorescent intensity and quantitative statistical analysis of iNOS and ACOD1 in intestinal tissues of NEC patients and healthy control (n = 5 per group). (H) Immunofluorescence analysis of CD206 and ACOD1 in intestinal tissues of NEC patients and healthy control (= 5 per group). Data represent mean ± SD, Wilcoxon signed‐rank test, Two‐tailed (G H). p‐value as shown in Figure.
FIGURE 4
FIGURE 4
ACOD1 in macrophages protects mice from necrotizing enterocolitis (NEC). Representative confocal images of co‐localized in human intestinal tissue samples from NEC patients and controls. Red fluorescence represents ACOD1, while green fluorescence represents CD68. (B) Schematic representation of the experimental model for macrophage transplantation. (C) Representative images of H&E‐stained of the intestinal epithelial tissue in NEC NOG mice which received WT mice macrophage or ACOD1 mice macrophage (D) Severity score, NOG‐NEC (n = 5), WT‐NOG‐NEC (n = 4), ACOD1−/−NOG‐NEC (n = 5). (E) Survival curve, the experimental groups were organized as in D. (F) Representative images of H&E‐stained of the intestinal epithelial tissue in ACOD1fl/fl and ACOD1fl/fl LysMcre mice random allocation in the NEC group and control group. (G) Severity score and survival curve (H) of ACOD1fl/fl and ACOD1fl/fl LysMcre mice, ACOD1fl/fl Ctrl, ACOD1fl/fl NEC, ACOD1fl/fl LysMcre Ctrl, ACOD1fl/fl LysMcre NEC (n = 12 per group). (I) Quantification of FITC‐labelled dextran levels in the plasma of mice across different experimental groups (n = 6 per group). (J) mRNA expression of CD68 and IL‐6. (K) in the intestinal epithelial tissue of mice across different experimental groups, (n = 12 per group). (L) Protein expression of IL‐6, IL‐1β (M), and TNF‐α (N) in the intestinal epithelial tissue of mice across different experimental groups (n = 12 per group). Data represent mean ± SD, Wilcoxon signed‐rank test, Two‐tailed (D); Unpaired t‐test, Two‐tailed (G I‐N); Log‐rank test (E and H). p‐value as shown in Figure.
FIGURE 5
FIGURE 5
Deficiency promotes macrophages switch towards glycolysis in necrotizing enterocolitis (NEC). (A) Volcano plot and heatmap (B) display of differential genes in Smart‐RNA‐seq analysis. (C) Top 10 enriched pathways in KEGG pathway enrichment analysis. (D) JC‐1 staining was determined by flow cytometry, MMP = Red/Green mean ratio, n = 4 per group. (E) OCR profile plot and (F) ECAR profile plot in macrophage (day 3 of cell culture) from WT and ACOD1 −/− mice, determined by mitochondrial stress test assay (= 16 per group). (G) Representative images of H&E‐stained of the intestinal epithelial tissue. (H) Severity score and survival curve (I) of WT and ACOD1−/− mice, NOG‐Ctrl (n = 6), WT‐NOG (n = 6), ACOD1−/− ‐NOG‐Ctrl (n = 5), WT‐NOG (n = 5). Data represent mean ± SD, Wilcoxon signed‐rank test, Two‐tailed (D and H), Log‐rank test (I). p‐value as shown in Figure.
FIGURE 6
FIGURE 6
4OI plays a therapeutic role in necrotizing enterocolitis (NEC) by promoting mitochondrial activity. (A) Representative images of H&E‐stained of intestinal epithelial tissue of mice with indicated treatment. (B) Severity score. (C) survival curve. Ctrl, NEC‐Vehicle, NEC‐4OI (n = 24 per group). (D) OCR profile plot and (E) ECAR profile plot in macrophage (day 3 of cell culture) from NEC mice treated with 4OI compared with control group, determined by mitochondrial stress test assay. Ctrl (= 4), NEC‐Veh (= 6), NEC‐4OI (n = 5). (F) JC‐1 staining in macrophage was determined by flow cytometry. Ctrl, NEC‐Veh, NEC‐4OI, NEC‐ITA, (n = 4 per group). (G) quantitative statistical analysis of MMP, MMP = Red/Green mean ratio. (H) JC‐1 staining in THP‐1 cell was determined by flow cytometry, Ctrl, CCCP, LPS, LPS‐4OI (n = 3 per group). (I) Quantitative statistical analysis of MMP in THP‐1 cell, MMP = Red/Green mean ratio. (J) Representative images of H&E‐stained intestinal epithelial tissue of NOG mice with treatment of macrophage from ACOD1‐/‐ mice or WT mice macrophage and indicated treatment. ATO, atovaquone. (K) Severity score of NOG mice with indicated treatment. Ctrl, NEC, 4OI, NEC‐4OI, (n = 15 per group). Data represent mean ± SD, Unpaired t‐test, Two‐tailed (B); Wilcoxon signed‐rank test, Two‐tailed (G I K), Log‐rank test, n = 24 per group (C). p‐value as shown in Figure.

Similar articles

References

    1. Nino DF, Sodhi CP, Hackam DJ. Necrotizing enterocolitis: new insights into pathogenesis and mechanisms. Nat Rev Gastroenterol Hepatol. 2016;13(10):590‐600. doi: 10.1038/nrgastro.2016.119 - DOI - PMC - PubMed
    1. Neu J, Walker WA. Necrotizing enterocolitis. N Engl J Med. 2011;364(3):255‐264. doi: 10.1056/NEJMra1005408 - DOI - PMC - PubMed
    1. Blakely ML, Tyson JE, Lally KP, et al. Initial Laparotomy versus peritoneal drainage in extremely low birthweight infants with surgical necrotizing enterocolitis or isolated intestinal perforation: a multicenter randomized clinical trial. Ann Surg. 2021;274(4):e370‐e380. doi: 10.1097/SLA.0000000000005099 - DOI - PMC - PubMed
    1. Cao X, Zhang L, Jiang S, et al. Epidemiology of necrotizing enterocolitis in preterm infants in China: a multicenter cohort study from 2015 to 2018. J Pediatr Surg. 2022;57(3):382‐386. doi: 10.1016/j.jpedsurg.2021.05.014 - DOI - PubMed
    1. Cho SX, Rudloff I, Lao JC, et al. Characterization of the pathoimmunology of necrotizing enterocolitis reveals novel therapeutic opportunities. Nat Commun. 2020;11(1):5794. doi: 10.1038/s41467-020-19400-w - DOI - PMC - PubMed

LinkOut - more resources