

P-Coumaric Acid Improves Skeletal Muscle Atrophy in Chronic Kidney Disease by Modulating TLR4/MyD88/NF-κB-Mediated Inflammation and Oxidative Stress
- PMID: 40673642
- PMCID: PMC12268968
- DOI: 10.1111/jcmm.70659
P-Coumaric Acid Improves Skeletal Muscle Atrophy in Chronic Kidney Disease by Modulating TLR4/MyD88/NF-κB-Mediated Inflammation and Oxidative Stress
Abstract
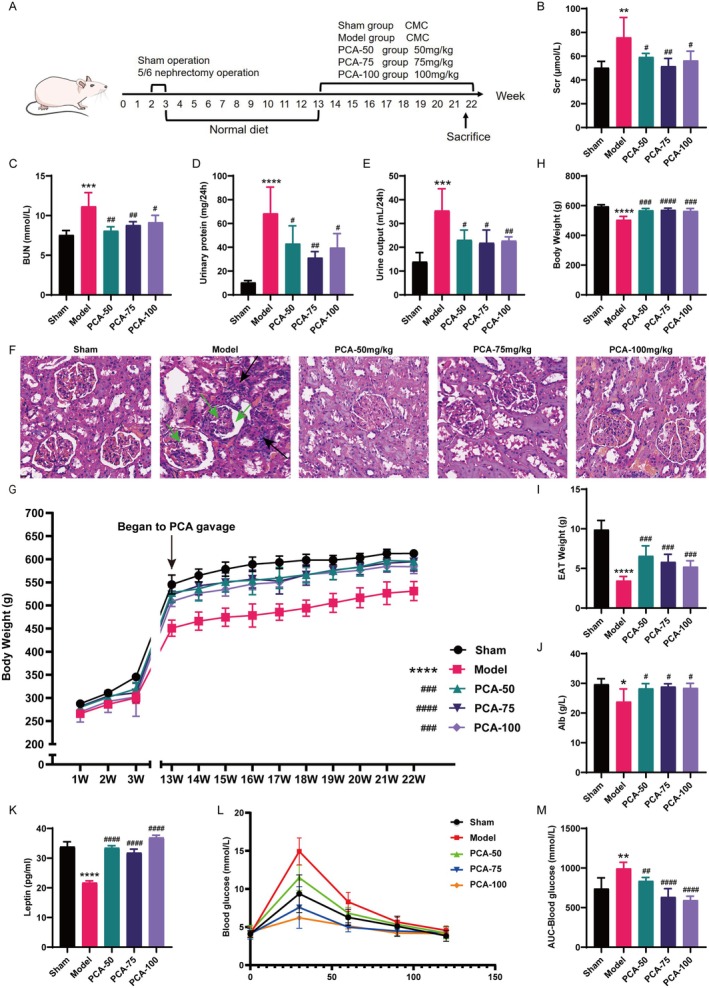
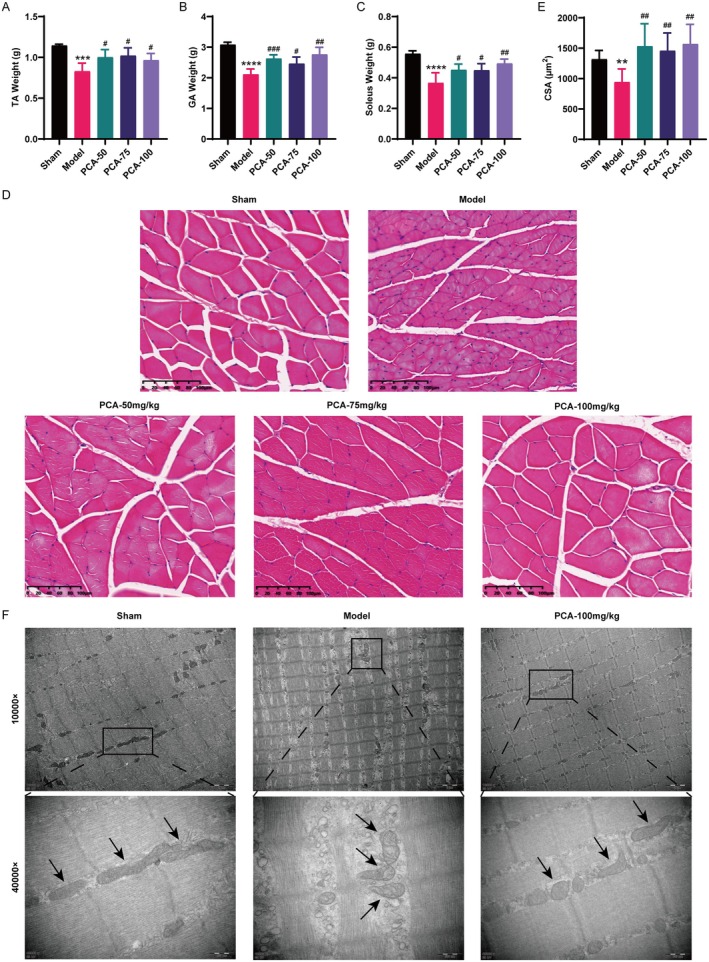
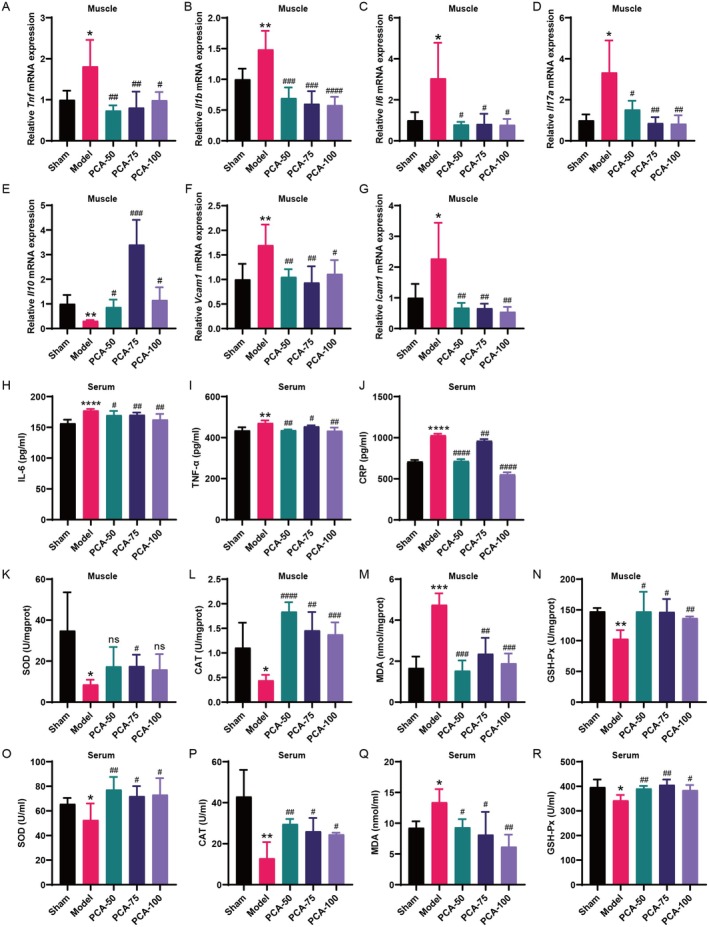
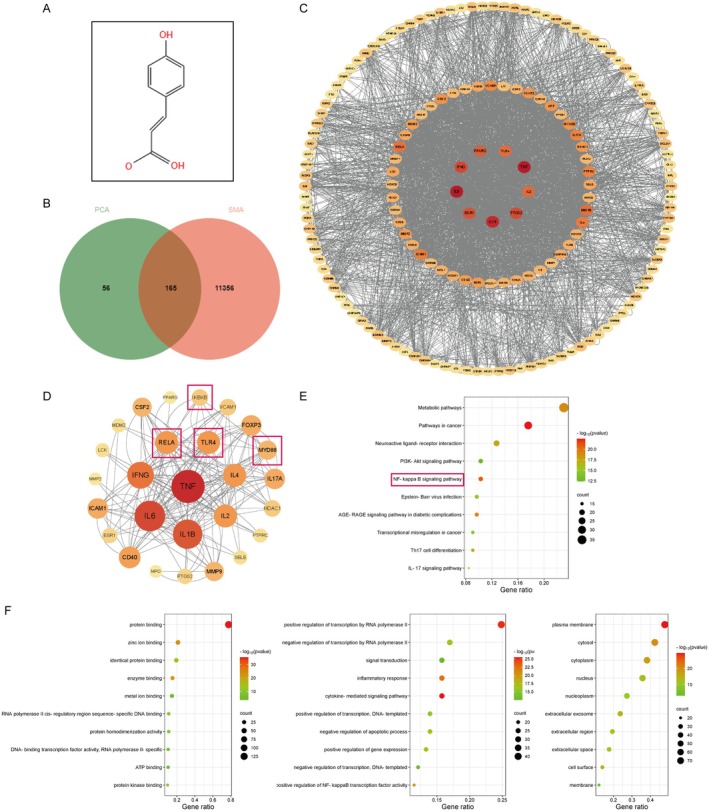
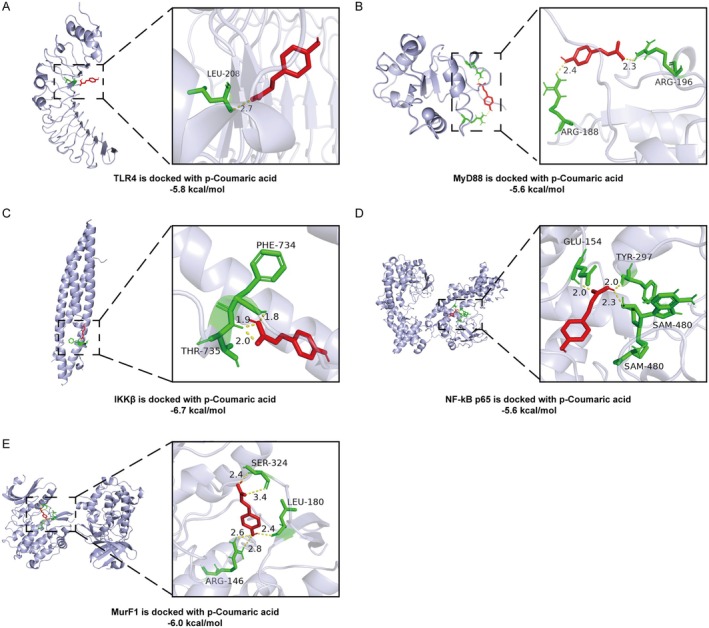
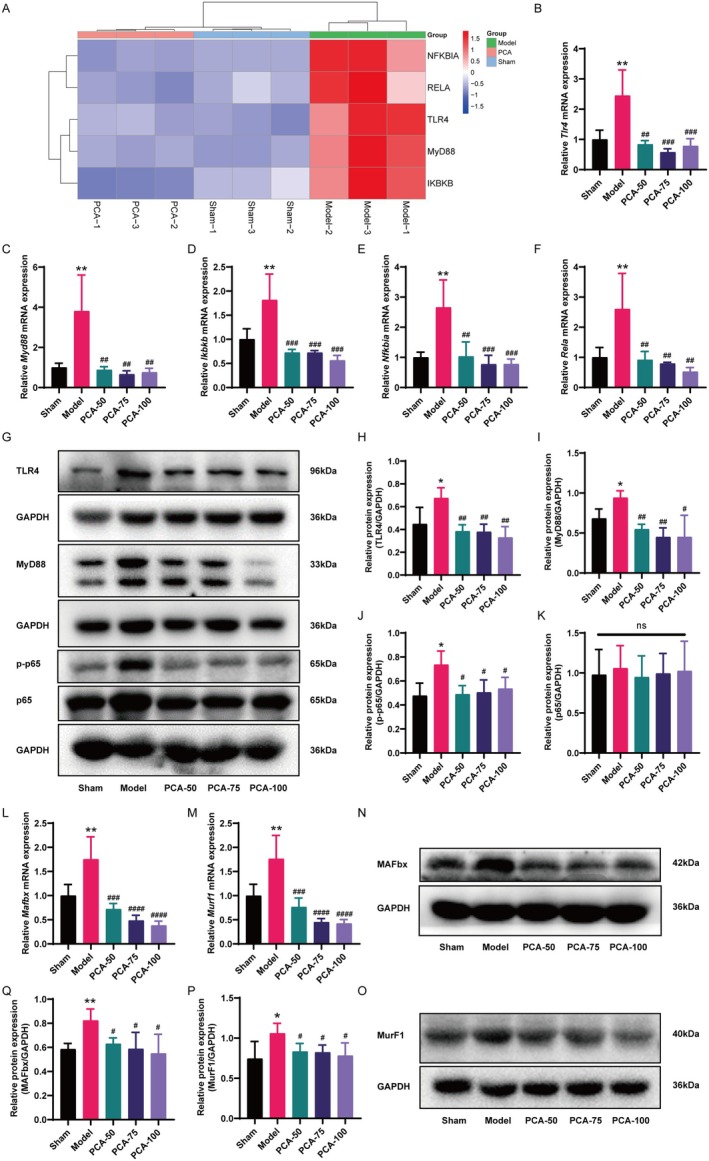
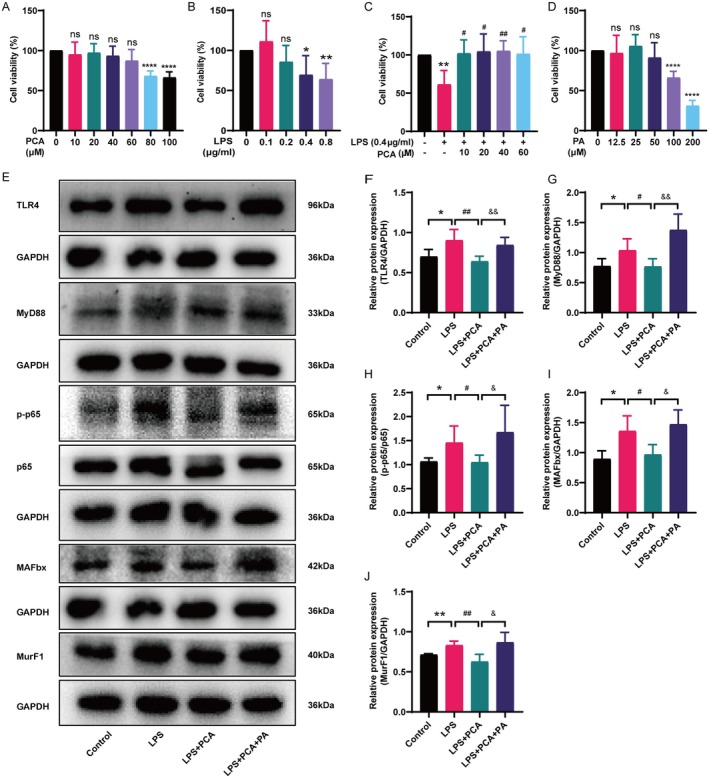
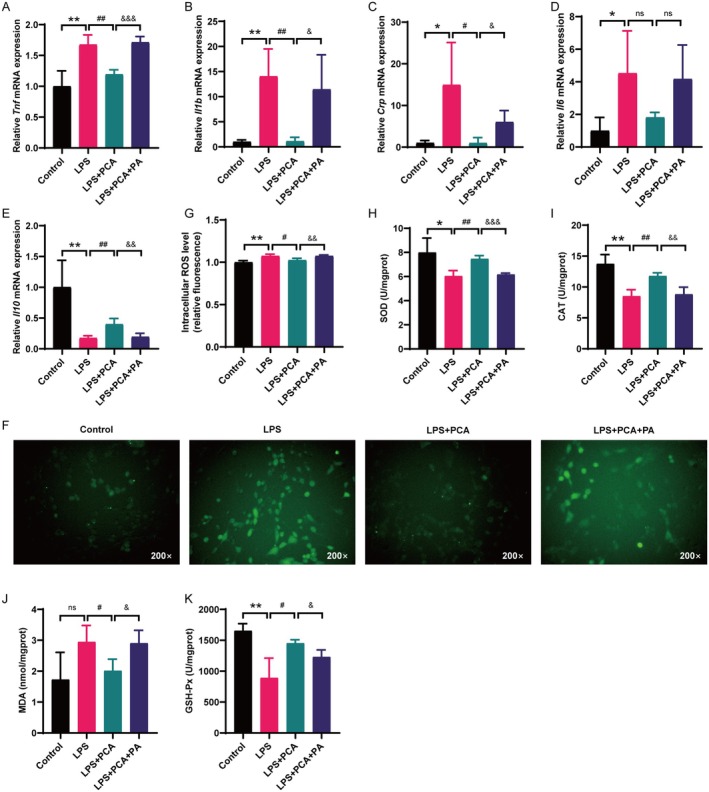
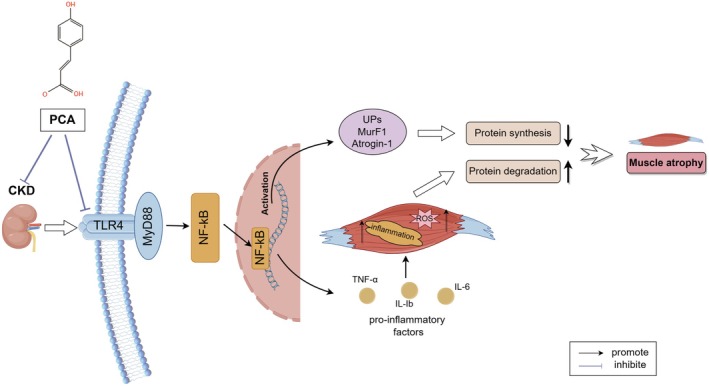
Skeletal muscle atrophy is a prevalent complication in chronic kidney disease (CKD), and its pathogenesis is closely related to inflammation and oxidative stress. P-Coumaric acid (PCA) is a phenolic acid with anti-inflammatory and antioxidant pharmacological actions. This research aims to investigate the effect of PCA on CKD-induced muscle atrophy and its underlying mechanism. In our study, in vivo and in vitro models were established by using 5/6 nephrectomized rats and LPS-induced C2C12 myoblasts. The experimental results showed that PCA ameliorated kidney injury in CKD rats and increased skeletal muscle weight and the cross-sectional area of muscle fibres. In both CKD rats and LPS-induced C2C12 myoblasts, PCA also exhibited anti-inflammatory and antioxidant effects, reduced the levels of pro-inflammatory cytokines and enhanced the activity of antioxidant enzymes. Network pharmacology studies have identified 165 common targets between PCA and skeletal muscle atrophy. Furthermore, the experimental results also demonstrated that PCA decreased the expression of TLR4, MyD88, NF-κB p65, MurF1 and MAFbx at both the protein and mRNA levels. Additionally, in vitro experiments showed that the use of TLR4 agonists could reverse the muscle-protective effect of PCA. In summary, this study illustrated that PCA ameliorated skeletal muscle atrophy in CKD rats by inhibiting the TLR4/MyD88/NF-κB pathway.
Keywords: P‐Coumaric acid; TLR4/MyD88/NF‐κB pathway; inflammation; oxidative stress; skeletal muscle atrophy.
© 2025 The Author(s). Journal of Cellular and Molecular Medicine published by Foundation for Cellular and Molecular Medicine and John Wiley & Sons Ltd.
Conflict of interest statement
The authors declare no conflicts of interest.
Figures
Similar articles
-
Caffeic acid alleviates skeletal muscle atrophy in 5/6 nephrectomy rats through the TLR4/MYD88/NF-kB pathway.Biomed Pharmacother. 2024 May;174:116556. doi: 10.1016/j.biopha.2024.116556. Epub 2024 Apr 17. Biomed Pharmacother. 2024. PMID: 38636398
-
Mahonia bealei (Fort.) Carr. Leaf extract modulates the TLR2/MyD88/NF-κB signaling pathway to inhibit PGN-induced inflammation in RAW264.7 cells.J Ethnopharmacol. 2025 Mar 26;344:119510. doi: 10.1016/j.jep.2025.119510. Epub 2025 Feb 17. J Ethnopharmacol. 2025. PMID: 39971016
-
HMGB1-mediated pyroptosis promotes inflammation and contributes to skeletal muscle atrophy induced by cigarette smoke.Am J Physiol Cell Physiol. 2025 Jul 1;329(1):C325-C340. doi: 10.1152/ajpcell.01014.2024. Epub 2025 May 30. Am J Physiol Cell Physiol. 2025. PMID: 40445389
-
Skeletal muscle atrophy in clinical and preclinical models of chronic kidney disease: A systematic review and meta-analysis.J Cachexia Sarcopenia Muscle. 2024 Feb;15(1):21-35. doi: 10.1002/jcsm.13400. Epub 2023 Dec 7. J Cachexia Sarcopenia Muscle. 2024. PMID: 38062879 Free PMC article.
-
Exploring the mechanism of TLR4/NF-κB signaling pathway in hypoxic myocardial injury: Implications for traditional Chinese medicine therapy.Fitoterapia. 2025 Sep;185:106721. doi: 10.1016/j.fitote.2025.106721. Epub 2025 Jun 30. Fitoterapia. 2025. PMID: 40602631 Review.
References
-
- Carrero J. J., Thomas F., Nagy K., et al., “Global Prevalence of Protein‐Energy Wasting in Kidney Disease: A Meta‐Analysis of Contemporary Observational Studies From the International Society of Renal Nutrition and Metabolism,” Journal of Renal Nutrition 28, no. 6 (2018): 380–392, https://doi.org10.1053/j.jrn.2018.08.006. - PubMed
-
- Piccoli G. B., Cederholm T., Avesani C. M., et al., “Nutritional Status and the Risk of Malnutrition in Older Adults With Chronic Kidney Disease – Implications for Low Protein Intake and Nutritional Care: A Critical Review Endorsed by ERN‐ERA and ESPEN,” Clinical Nutrition 42, no. 4 (2023): 443–457, 10.1016/j.clnu.2023.01.018. - DOI - PubMed
-
- Hanna R. M., Ghobry L., Wassef O., Rhee C. M., and Kalantar‐Zadeh K., “A Practical Approach to Nutrition, Protein‐Energy Wasting, Sarcopenia, and Cachexia in Patients With Chronic Kidney Disease,” Blood Purification 49, no. 1–2 (2020): 202–211, https://doi.org10.1159/000504240. - PubMed
MeSH terms
Substances
Grants and funding
LinkOut - more resources
Full Text Sources
Medical
