. 2025 Jul 1;14(7):10.
doi: 10.1167/tvst.14.7.10.

Retinal Mid-Peripheral Capillary Free Zones Are Enlarged in Diabetic Patients With No Evidence of Clinical Retinopathy

Affiliations

Retinal Mid-Peripheral Capillary Free Zones Are Enlarged in Diabetic Patients With No Evidence of Clinical Retinopathy

Edmund Arthur et al. Transl Vis Sci Technol. .

Abstract

Purpose: To compare the width of the mid-peripheral capillary free zones (CFZs; periarteriole and perivenule) between diabetics with no diabetic retinopathy (DR) versus controls.

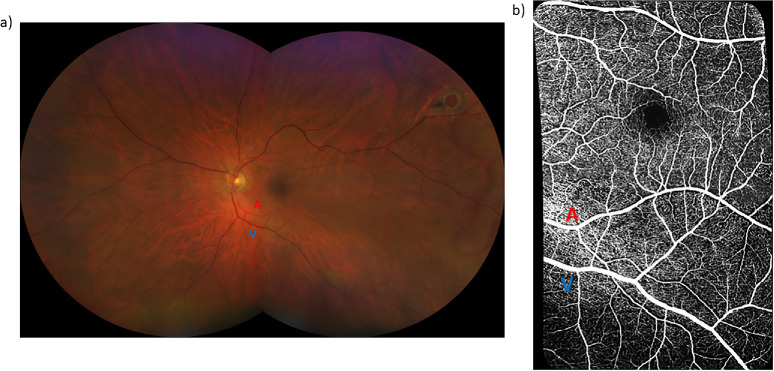
Methods: The 20° × 20° optical coherence tomography angiography images of paired arterioles, venules, and their adjacent capillaries within the macular and inferomacular regions of the superficial vascular plexus were obtained from 46 eyes of 28 diabetics with no DR (mean age, 59 years; range, 40-71 years) and 46 eyes of 31 controls (mean age, 59 years; range, 46-78 years). There was no significant difference in age between groups (P = 0.77). The macular and inferomacular images were montaged to generate a wider field of view, followed by the application of a vesselness filter and Otsu thresholding. The mid-peripheral CFZ width was calculated using previously established MATLAB algorithms. Generalized linear mixed models were used to compare the mid-peripheral CFZs between groups, accounting for correlation between eyes.

Results: The periarteriole CFZ width was greater in diabetics with no DR (73.3 ± 6.49 µm) compared to controls (67.3 ± 7.08 µm; P < 0.001, Cohen's d = 0.88). Similarly, the perivenule CFZ width was larger in diabetics with no DR (60.8 ± 6.40 µm) compared to controls (54.8 ± 4.58 µm; P < 0.001, Cohens' d = 1.08).

Conclusions: Our results demonstrate larger mid-peripheral CFZ width in diabetics with no DR. The mid-peripheral CFZs show promise as a potential novel retinal vascular biomarker for early DR detection.

Translational relevance: Our study shows the potential clinical utility of the mid-peripheral CFZs for early DR detection.


Conflict of interest statement

Disclosure: E. Arthur, None; S. Ravichandran, None; A. Rothstein, None; K. Brown, None; G.B. Jonnadula, None; C.F. Murchison, None; M.B. Grant, None

Figures

Figure 1.
Figure 1.
Color fundus and montaged OCTA images depicting a paired arteriole and venule located inferior to the fovea in a 67-year-old diabetic patient with an HbA1c level of 6. (a) The color fundus image highlights the paired arteriole and venule (marked with a red A and blue V, respectively), situated 9.7° and 16° inferior to the fovea, respectively. (b) The corresponding montaged OCTA image illustrates the paired arteriole and venule (indicated by the red A and blue V, respectively), along with the surrounding capillaries. The periarteriole and perivenule CFZs appear as dark gaps surrounding the arteriole and venule, respectively.
Figure 2.
Figure 2.
Montaged and 20° × 20° macular-centered OCTA images of a 40-year-old diabetic with HbA1c of 5.9. (a) Montaged OCTA image showing periarteriole CFZ (red A and dots) and perivenule CFZ (blue V and dots). Vessel parameters are as follows: periarteriole CFZ = 70.6 µm, arteriole diameter = 110 µm, arteriole distance from fovea = 16.4°, arteriole linear distance of sampling = 6.51 mm, perivenule CFZ = 53.8 µm, venule diameter = 123 µm, venule distance from fovea = 16.6°, and venule linear distance of sampling = 5.69 mm. (b) Vesselness filtered and Otsu thresholded image. (c) Negative or reverse contrast image of (b). Vessel density was computed as the ratio of white pixels in (b) to the total area of the image (∼36 mm2), the sum of the areas of white pixels in (a) and (b). FAZ area of the participant = 0.58 mm2 (FAZ effective diameter = 859 µm), and vessel density ratio = 0.52. Scale bar: 200 µm.
Figure 3.
Figure 3.
Mean plots with SD error bars showing large mid-peripheral CZs in diabetics with no DR versus controls of similar age. (a) Large periarteriole CFZs in diabetics with no DR (73.3 ± 6.49 µm) versus controls (67.3 ± 7.08 µm) (P < 0.001), with a large effect size (Cohen's d = 0.88). (b) Large perivenule CFZs in diabetics with no DR (60.8 ± 6.40 µm) versus controls (54.8 ± 4.58 µm) (P < 0.001), with a large effect size (Cohens’ d = 1.08). *Both plots in (a) and (b) were significant after Bonferroni correction (P < 0.01).
Figure 4.
Figure 4.
The 20° × 20° OCTA images inferior to the fovea of a diabetic with no DR versus controls of similar age plus color fundus image of the diabetic showing large mid-peripheral CFZs in the former versus latter. (a) A 64-year-old control with periarteriole CFZ of 63.2 µm and perivenule CFZ width of 47.8 µm. (b) A 67-year-old diabetic with no DR with large periarteriole CFZ width (83.1 µm) and perivenule CFZ width (68.5 µm) compared to (a). (c) Corresponding color fundus image of the diabetic patient showing no DR. Both (a) and (b) have similar vessel parameters. Control: arteriole diameter = 86.6 µm, arteriole distance from fovea = 7.98°, arteriole linear distance of sampling = 6.05 mm, venule diameter = 115 µm, venule distance from fovea = 11.9°, venule linear distance of sampling = 6.45 mm. Diabetic: arteriole diameter = 84.1 µm, arteriole distance from fovea = 9.95°, arteriole linear distance of sampling = 6.37 mm, venule diameter = 113 µm, venule distance from fovea = 12.6°, venule linear distance of sampling = 6.43 mm. Scale bar: 200 µm.
Figure 5.
Figure 5.
Mean plots with SD error bars showing large FAZ size and effective diameter, and reduced vessel density in diabetics wit}\h no DR versus controls of similar age. (a) Large FAZ size in diabetics with no DR (0.39 ± 0.136 mm2) versus controls (0.317 ± 0.121 mm2) (P = 0.015), with a medium effect size (Cohen's d = 0.57). (b) Large FAZ effective diameter in diabetics with no DR (692 ± 132 µm) versus controls (623 ± 127 µm) (P = 0.022), with a medium effect size (Cohen's d = 0.53). Neither (a) nor (b) remained significant after Bonferroni correction (P > 0.01). (c) A trend in reduced vessel density in diabetics with no DR (0.488 ± 0.044) versus controls (0.508 ± 0.032 (P = 0.053), with a medium effect size (Cohen's d = 0.52).
Figure 6.
Figure 6.
Macular-centered 20° × 20° OCTA images of a diabetic with no DR versus controls of similar age, plus color fundus image of the diabetic showing large FAZ metrics and reduced vessel density in the former compared with the latter. (a) OCTA image of a 51-year-old control with FAZ size of 0.28 mm2, FAZ effective diameter of 597 µm, and vessel density of 0.53. (b) OCTA image of a 52-year-old diabetic with no DR with HbA1c of 7 showing large FAZ size (0.40 mm2) and effective diameter (714 µm), and reduced vessel density (0.49) compared to (a). Corresponding color fundus image of the diabetic patient showing no DR. Scale bar: 200 µm.
Figure 7.
Figure 7.
ROC curves of mid-peripheral CFZs, FAZ size and effective diameter, and vessel density plus multimodal model of these variables showing better diagnostic potential of the multimodal model. (a) ROC curves showing better diagnostic potential of the periarteriole (AUC = 0.716; 95% CI, 0.612–0.82; P < 0.001) and perivenule CFZs (AUC = 0.782; 95% CI, 0.69–0.874; P < 0.001) compared to FAZ size (AUC = 0.655; 95% CI, 0.543–0.768; P = 0.007) and effective diameter (AUC = 0.656; 95% CI, 0.544–0.769; P = 0.006). FAZ size did not remain significant after Bonferroni correction (P > 0.007). (b) ROC curves showing a better diagnostic potential of the multimodal of all vessel parameters (AUC = 0.816; 95% CI, 0.732–0.899; P < 0.001), compared to mid-peripheral CFZs (AUC = 0.799; 95% CI, 0.711–0.887; P < 0.001) and vessel density (AUC = 0.659; 95% CI, 0.547–0.771; P = 0.006).

Similar articles

References

    1. Yau JW, Rogers SL, Kawasaki R, et al.. Global prevalence and major risk factors of diabetic retinopathy. Diabetes Care. 2012; 35(3): 556–564 - PMC - PubMed
    1. Elsner AE, King BJ.. Screening for macular disorders: the optometrist's perspective. Clin Optom. 2015; 7: 15–38.
    1. Early Treatment Diabetic Retinopathy Study Research Group. Grading diabetic retinopathy from stereoscopic color fundus photographs—an extension of the modified Airlie House classification. ETDRS Report Number 10. Ophthalmology. 1991; 98(5): 786–806. - PubMed
    1. Wilkinson CP, Ferris FL III, Klein RE, et al.. Proposed international clinical diabetic retinopathy and diabetic macular edema disease severity scales. Ophthalmology. 2003; 110(9): 1677–1682. - PubMed
    1. Burns SA, Elsner AE, Chui TY, et al.. In vivo adaptive optics microvascular imaging in diabetic patients without clinically severe diabetic retinopathy. Biomed Opt Express. 2014; 5(3): 961–974. - PMC - PubMed