

ANA-12 Targets and Inhibits BDNF/TrkB Signaling to Alleviate Pain Behaviors in Rheumatoid Arthritis Mice
- PMID: 40673956
- PMCID: PMC12271264
- DOI: 10.1007/s11064-025-04487-8
ANA-12 Targets and Inhibits BDNF/TrkB Signaling to Alleviate Pain Behaviors in Rheumatoid Arthritis Mice
Abstract
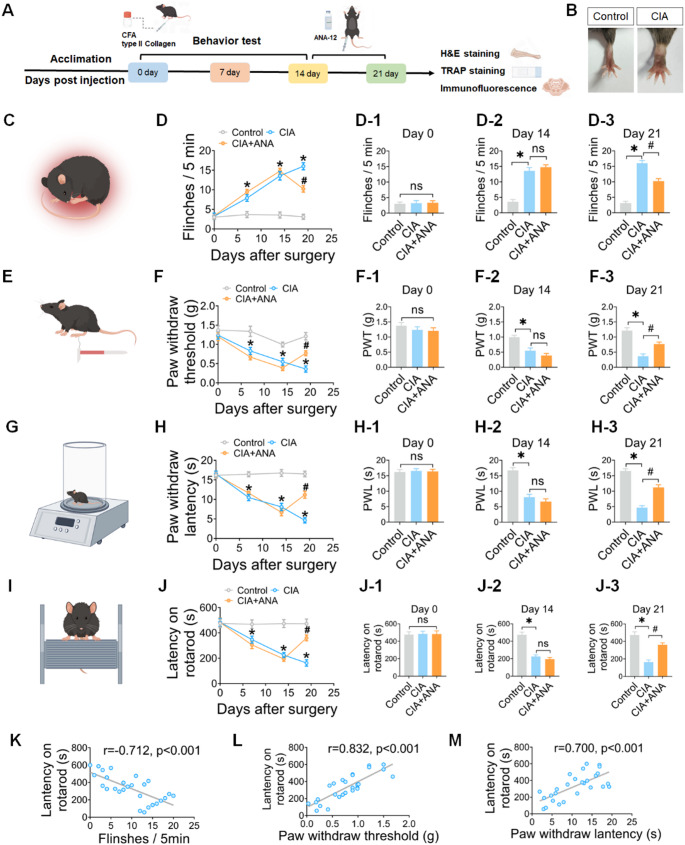
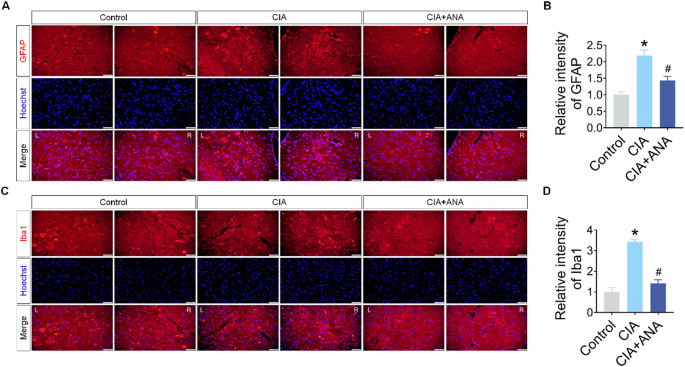
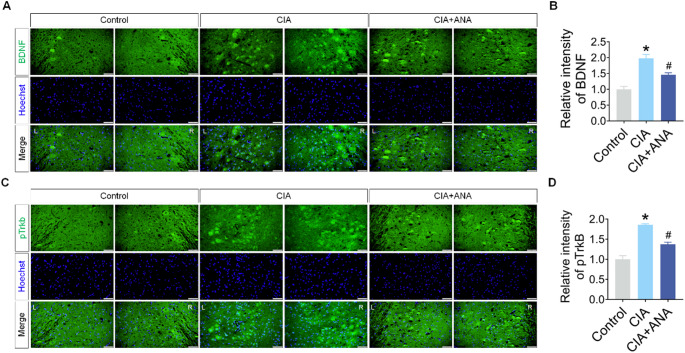
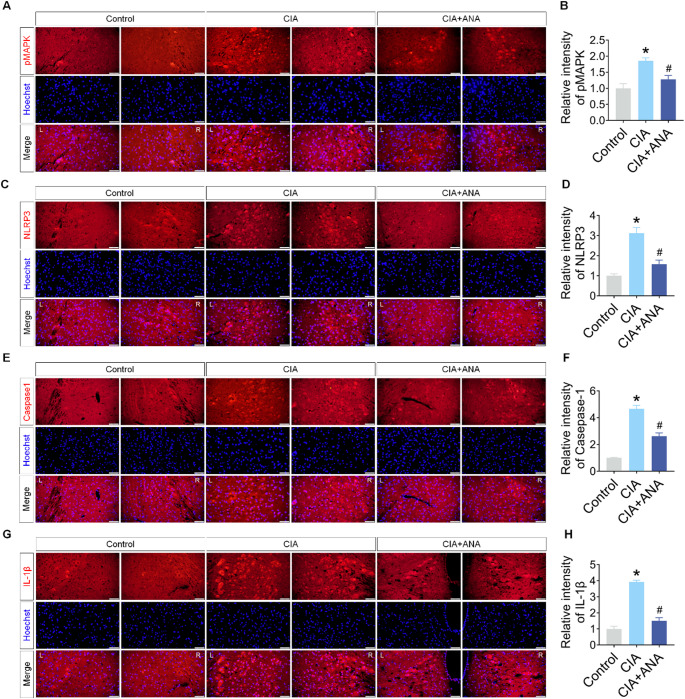
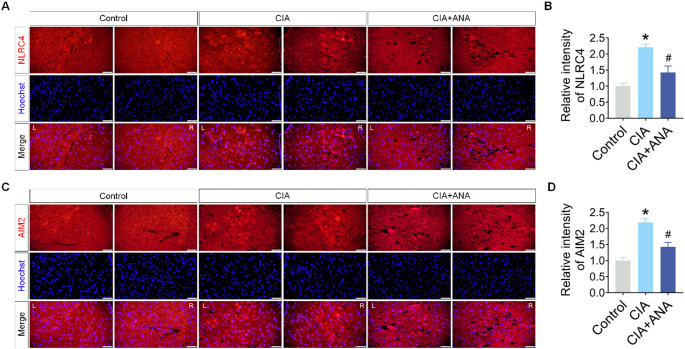
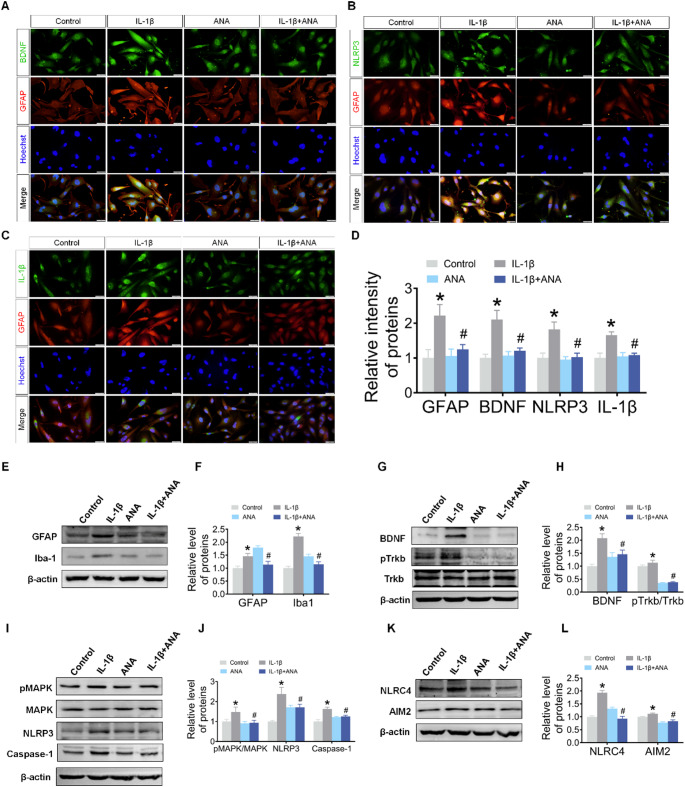
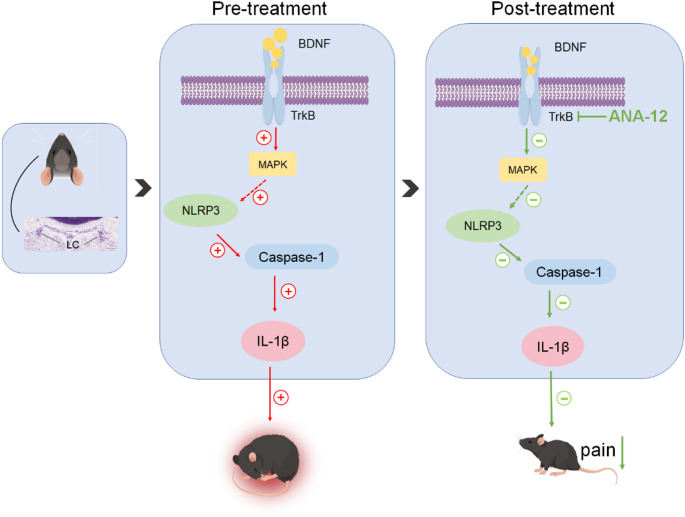
Rheumatoid arthritis (RA) is a chronic, systemic, inflammatory disease. Sensitization of central pain pathways by pro-inflammatory mediators has been implicated in RA pain. Locus coeruleus (LC) functions in pain pathways. Brain-derived neurotrophic factor (BDNF) participates in the modulation of nociception and pain. A mouse model of RA immunized with collagen-induced arthritis (CIA) was used for investigating the mechanisms of pain relief by administration of the tropomyosin receptor kinase B (TrkB) receptor antagonist ANA-12. We measured the pain behaviors and locomotor activity and found increased pain sensitivity and locomotor deficit in RA mice; ANA-12 treatment reduced pain behaviors and promoted locomotor function recovery. The glial activation and increased activities of BDNF/TrkB and MAPK signal pathways were found in LC of RA mice. The components of NLRP3 inflammasome were all increased and consequently enhanced the production of pro-inflammatory cytokine interleukin (IL)-1β. Upon ANA-12 treatment, glial cell activation was reduced, BDNF/TrkB and MAPK pathways were suppressed, and the expression levels of the above-mentioned proteins were reduced. Finally, U251 cells were conducted to further confirm the regulatory mechanisms of ANA-12 on inflammation. The results showed the colocalization of BDNF/NLRP3/IL-1β and GFAP. ANA-12 treatment decreased the protein levels of BDNF, TrkB, MAPK, NLRP3, and caspase-1 in IL-1β-induced cells. Besides, ANA-12 treatment decreased NLRC4 and AIM2 inflammasomes both in RA mice and IL-1β-induced cells. These results suggested that ANA-12 alleviates hyperalgesia in RA mice by inhibiting BDNF/TrkB signaling in LC, thereby reducing glial cell activation and inflammatory cytokine release.
Keywords: ANA-12; Arthritis pain; Brain-derived neurotrophic factor; Inflammatory factor; Locus coeruleus.
© 2025. The Author(s).
Conflict of interest statement
Declarations. Ethical Approval: The animal experiment was approved by the Ethics Committee of Animal Experimentation at Hubei University of Science and Technology (Approval No. 2023-03-028). Competing Interests: The authors declare no competing interests.
Figures
Similar articles
-
Inhibition of TrkB-BDNF positive feedback loop attenuates intervertebral disc degeneration and low back pain in a composite mouse model.Brain Behav Immun. 2025 Aug;128:37-53. doi: 10.1016/j.bbi.2025.03.029. Epub 2025 Mar 25. Brain Behav Immun. 2025. PMID: 40147506
-
Brain-derived neurotrophic factor contributes to activity-induced muscle pain in male but not female mice.Brain Behav Immun. 2024 Aug;120:471-487. doi: 10.1016/j.bbi.2024.06.019. Epub 2024 Jun 24. Brain Behav Immun. 2024. PMID: 38925417 Free PMC article.
-
Resveratrol reduces the activation of NLRP3 inflammasomes in rheumatoid arthritis through SIRT1 and ITGB α5β1, especially in patients with high expression of ACPA.Phytomedicine. 2025 Aug;144:156897. doi: 10.1016/j.phymed.2025.156897. Epub 2025 May 29. Phytomedicine. 2025. PMID: 40480022
-
BDNF/TrkB signaling pathway and WDR neurons: Core factors inducing central sensitization of neuropathic pain.Life Sci. 2025 Sep 15;377:123796. doi: 10.1016/j.lfs.2025.123796. Epub 2025 Jun 4. Life Sci. 2025. PMID: 40480621 Review.
-
Celecoxib for rheumatoid arthritis.Cochrane Database Syst Rev. 2017 Jun 9;6(6):CD012095. doi: 10.1002/14651858.CD012095.pub2. Cochrane Database Syst Rev. 2017. PMID: 28597983 Free PMC article.
References
-
- Di Matteo A, Bathon JM, Emery P (2023) Rheumatoid arthritis. Lancet 402:2019–2033. 10.1016/s0140-6736(23)01525-8 - PubMed
-
- Gravallese EM, Firestein GS (2023) Rheumatoid arthritis - common origins, divergent mechanisms. N Engl J Med 388:529–542. 10.1056/NEJMra2103726 - PubMed
-
- Smolen JS, Aletaha D, McInnes IB (2016) Rheumatoid arthritis. Lancet 388:2023–2038. 10.1016/s0140-6736(16)30173-8 - PubMed
-
- Smolen JS, Aletaha D, Barton A, Burmester GR, Emery P, Firestein GS, Kavanaugh A, McInnes IB, Solomon DH, Strand V, Yamamoto K (2018) Rheumatoid arthritis. Nat Rev Dis Primers 4:18001. 10.1038/nrdp.2018.1 - PubMed
-
- Smith MH, Berman JR (2022) What is rheumatoid arthritis?? JAMA 327:1194. 10.1001/jama.2022.0786 - PubMed
MeSH terms
Substances
Grants and funding
LinkOut - more resources
Full Text Sources
Medical
Miscellaneous
