

Accidental and Regulated Cell Death in Yeast Colony Biofilms
- PMID: 40673959
- PMCID: PMC12271256
- DOI: 10.1007/s11538-025-01470-w
Accidental and Regulated Cell Death in Yeast Colony Biofilms
Abstract
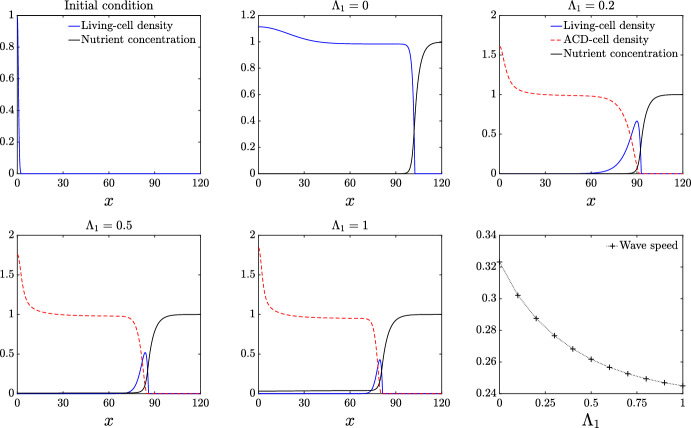
The yeast species Saccharomyces cerevisiae is one of the most intensively studied organisms on the planet due to it being an excellent eukaryotic model organism in molecular and cell biology. In this work, we investigate the growth and morphology of yeast colony biofilms, where proliferating yeast cells reside within a self-produced extracellular matrix. This research area has garnered significant scientific interest due to its applicability in the biological and biomedical sectors. A central feature of yeast colony biofilm expansion is cellular demise, which is onset by one of two independent mechanisms: either accidental cell death (ACD) or regulated cell death (RCD). In this article, we generalise a continuum model for the nutrient-limited growth of a yeast colony biofilm to include the effects of ACD and RCD. This new model involves a system of four coupled nonlinear reaction-diffusion equations for the yeast-cell density, the nutrient concentration, and two species of dead cells. Numerical solutions of the spatially one and two-dimensional governing equations reveal the impact that ACD and RCD have on expansion speed, morphology and cell distribution within the colony biofilm. Our results are in good qualitative agreement with our own experiments.
Keywords: Saccharomyces cerevisiae; Apoptosis; Instability; Necrosis; Phloxine B; Reaction–diffusion.
© 2025. The Author(s).
Conflict of interest statement
Declarations. Competing Interests: We have no competing interests to declare.
Figures


Similar articles
-
High-Throughput Indirect Monitoring of TORC1 Activation Using the pTOMAN-G Plasmid in Yeast.Bio Protoc. 2025 Jun 20;15(12):e5356. doi: 10.21769/BioProtoc.5356. eCollection 2025 Jun 20. Bio Protoc. 2025. PMID: 40620813 Free PMC article.
-
Non-disruptive matrix turnover is a conserved feature of biofilm aggregate growth in paradigm pathogenic species.mBio. 2025 Mar 12;16(3):e0393524. doi: 10.1128/mbio.03935-24. Epub 2025 Feb 21. mBio. 2025. PMID: 39982068 Free PMC article.
-
Systemic pharmacological treatments for chronic plaque psoriasis: a network meta-analysis.Cochrane Database Syst Rev. 2021 Apr 19;4(4):CD011535. doi: 10.1002/14651858.CD011535.pub4. Cochrane Database Syst Rev. 2021. Update in: Cochrane Database Syst Rev. 2022 May 23;5:CD011535. doi: 10.1002/14651858.CD011535.pub5. PMID: 33871055 Free PMC article. Updated.
-
The effect of sample site and collection procedure on identification of SARS-CoV-2 infection.Cochrane Database Syst Rev. 2024 Dec 16;12(12):CD014780. doi: 10.1002/14651858.CD014780. Cochrane Database Syst Rev. 2024. PMID: 39679851 Free PMC article.
-
Systemic pharmacological treatments for chronic plaque psoriasis: a network meta-analysis.Cochrane Database Syst Rev. 2020 Jan 9;1(1):CD011535. doi: 10.1002/14651858.CD011535.pub3. Cochrane Database Syst Rev. 2020. Update in: Cochrane Database Syst Rev. 2021 Apr 19;4:CD011535. doi: 10.1002/14651858.CD011535.pub4. PMID: 31917873 Free PMC article. Updated.
References
-
- Beauvais A, Loussert C, Prevost MC, Verstrepen K, Latgé JP (2009) Characterization of a biofilm-like extracellular matrix in FLO1-expressing Saccharomyces cerevisiae cells. FEMS Yeast Res 9(3):411–419. 10.1111/j.1567-1364.2009.00482.x - PubMed
-
- Ben-Jacob E, Cohen I, Levine H (2000) Cooperative self-organization of microorganisms. Adv Phys 49(4):395–554. 10.1080/000187300405228
-
- Bojsen RK, Andersen KS, Regenberg B (2012) Saccharomyces Cerevisiae – a model to uncover molecular mechanisms for yeast biofilm biology. FEMS Immunol Med Microbiol 65(2):169–182. 10.1111/j.1574-695X.2012.00943.x - PubMed
MeSH terms
Grants and funding
LinkOut - more resources
Full Text Sources
