. 2025 Jul 17;135(18):e187371.
doi: 10.1172/JCI187371. eCollection 2025 Sep 16.

Aggressive B cell lymphomas retain ATR-dependent determinants of T cell exclusion from the germinal center dark zone

Affiliations

Aggressive B cell lymphomas retain ATR-dependent determinants of T cell exclusion from the germinal center dark zone

Valeria Cancila et al. J Clin Invest. .

Abstract

The germinal center (GC) dark zone (DZ) and light zone represent distinct anatomical regions in lymphoid tissue where B cell proliferation, immunoglobulin diversification, and selection are coordinated. Diffuse large B cell lymphomas (DLBCLs) with DZ-like gene expression profiles exhibit poor outcomes, though the reasons are unclear and are not directly related to proliferation. Physiological DZs exhibit an exclusion of T cells, prompting exploration of whether T cell paucity contributes to DZ-like DLBCL. We used spatial transcriptomic approaches to achieve higher resolution of T cell spatial heterogeneity in the GC and to derive potential pathways that underlie T cell exclusion. We showed that T cell exclusion from the DZ was linked to DNA damage response (DDR) and chromatin compaction molecular features characterizing the spatial DZ signature, and that these programs were independent of activation-induced cytidine deaminase (AID) activity. As ATR is a key regulator of DDR, we tested its role in the T cell inhibitory DZ transcriptional imprint. ATR inhibition reversed not only the DZ transcriptional signature, but also DZ T cell exclusion in DZ-like DLBCL in vitro microfluidic models and in in vivo samples of murine lymphoid tissue. These findings highlight that ATR activity underpins a physiological scenario of immune silencing. ATR inhibition may reverse the immune-silent state and enhance T cell-based immunotherapy in aggressive lymphomas with GC DZ-like characteristics.

Keywords: Cell biology; Immunology; Lymphomas; Molecular pathology; Oncology; T cells.


Figures

Figure 1
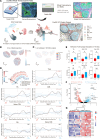
Figure 1. Spatial profiling uncovers unique transcriptional programs in the dark and light zones of GCs.
(A) Representative immunohistochemistry/immunofluorescence (IHC/IF) micrographs showing Ki-67 (green signal), NGFR (pink signal), CD4 (blue signal), and CD8 (brown signal) expression. Ki-67 highlights proliferative DZ regions; NGFR marks the LZ. Original magnification, ×200. Scale bar: 100 μm. (B) Representative IF images of CD3+ (green signal) and AID+ (red signal) cells within GCs. Original magnification, ×200. Scale bar: 100 μm. (C) Cumulative distribution functions (CDFs) of CD3+–AID+ nearest-neighbor distances in observed samples (pink curve) versus randomized controls (black curve). Statistical analysis: Wilcoxon’s test. (D) CDFs of CD68+–AID+ nearest-neighbor distances in observed versus randomized samples. Statistical analysis: Wilcoxon’s test. (E) DSP analysis of ROIs from DZ (n = 5) and LZ (n = 5) regions defined by CD20 and NGFR expression. (F) Volcano plot showing differentially expressed genes (adjusted P < 0.05) between DZ and LZ regions. (G) Heatmap of differentially expressed genes with unsupervised hierarchical clustering across ROIs. (H) Pathway enrichment of 169 DZ-upregulated genes using the Reactome Pathway database. (I) Pathway enrichment of 201 LZ-upregulated genes using Reactome.
Figure 2
Figure 2. T cell distribution in the GC varies by subset and function.
(A) Schematic overview of the CosMx SMI whole-transcriptome (WTX) workflow. FFPE tonsil tissues were processed, followed by IF imaging and single-cell segmentation. Spatial transcriptomics was performed for 18,935 RNA targets, detecting approximately 900–1,100 transcripts per cell. Data were visualized by uniform manifold approximation and projection (UMAP), and cell type identities were assigned via label transfer from the HCA tonsil reference dataset. (B) Spatial enrichment maps of DZ and LZ transcriptional signatures across 4 representative GCs. (C) Spatial distribution of T cell subtypes in GC microregions, highlighting immune cells including Tfh, CD8+, memory, naive CD8+, Treg, T helper, γδ T, T follicular regulatory, and DN cells. (D) Quantification of T cell distribution relative to the DZ-LZ boundary. Cells were analyzed within a –100 μm (DZ) to 100 μm (LZ) range, binned into 10-μm increments. Subtypes analyzed include Treg, Tfh, CD8+, naive CD4+, memory T, DN, and naive CD8+, with spatial trends depicted in a line graph. (E) Quantification of T cell subtypes including Tfh, memory CD4+, memory CD8+, DN, naive CD4+, and naive CD8+ cells based on MACSima hyperplex analyses to evaluate their differential distribution between DZ and LZ (n = 9 GCs). Statistical analysis was assessed using a 2-tailed unpaired Mann-Whitney test. Values are shown as mean ± SEM; *P < 0.05. (F) Volcano plot of differentially expressed genes between DZ and LZ B cells, highlighting upregulated genes in each region (adjusted P value < 0.05). (G) Heatmap of HLA class I and II gene expression in DZ versus LZ regions, clustered hierarchically by expression pattern.
Figure 3
Figure 3. The GC DZ spatial signature in aggressive B cell lymphomas is associated with reduced T cell infiltration.
(A) DZ enrichment scores correlating DZ gene expression and xCell T cell cytotype scores calculated in 8 DLBCL datasets. Positive DZ enrichment values indicate a positive association between the DZ spatial signature and the xCell cytotype scores, while negative values indicate a negative association. Statistical significance is shown with Wilcoxon’s adjusted P values. (B) UMAP projection of 1,078 harmonized DLBCL cases classified based on the DZ/LZ spatial signature; DZ-like cases (red), LZ-like cases (light blue), intermediate cases (green). (C) Kaplan-Meier survival plot showing overall survival (OS) of DZ-like, LZ-like, and intermediate groups from the harmonized dataset (1,078 cases). (D) DSP images of 11 ROIs selected within CD20 (green signal) and CD3E (red signal) infiltrates of a lymph node with DLBCL. Total expression of the DZ signature is shown from low (pink) to high (red). Original magnification, ×50. Scale bar: 250 μm. (E) Pie charts showing SpatialDecon cytotype scores across 11 ROIs, ranked by DZ signature expression. (F) Scatterplot with correlation line of DZ spatial signature expression and SpatialDecon T cell score across 11 ROIs (Kendall’s correlation, P < 0.05). (G) DSP images of lowest DZ signature expression ROI (001) and highest DZ signature expression ROI (004). (H) Schematic of DLBCL tissue microarray (TMA) consisting of 103 patient samples, analyzed using DSP WTA with DAPI, CD20 (red signal​), and CD3E (cyan signal) to observe T cell content and DZ signature expression. (I) Box plot comparing CD3 AOI nuclear count percentages between high and low DZ signature groups. Statistical analysis was performed using a 2-tailed unpaired Mann-Whitney test. Values are shown as mean ± SEM; ****P < 0.0001. (J) Scatterplot with correlation line of DZ spatial signature expression within the CD20+ segment and the percentage of CD3+ cells per ROI across 79 DLBCL samples. Statistical significance was assessed using Spearman’s correlation coefficient (R) and P value.
Figure 4
Figure 4. The spatial signature of DZ cells is independent of AICDA-related mutational processes.
(A) Representative photomicrographs of H&E and IHC for Cre+ and Ki-67+ cells on mesenteric lymph nodes from WT and Aicda–/– mice. Original magnification, ×200. Scale bars: 100 μm. (B and C) Quantitative analyses of Cre+ (B) and Ki-67+ (C) cells in WT and Aicda–/– GCs (n = 20). Statistical analysis was assessed using a 2-tailed unpaired Mann-Whitney test. Values are shown as mean ± SEM; ***P < 0.001, ****P < 0.0001. (D) Representative photomicrographs of H&E-stained sections from WT and Aicda–/– mesenteric lymph nodes involved in the Visium spatial transcriptome experiment profiling. Original magnification, ×50. Scale bars: 250 μm. (E) Spatial visualization of WT and Aicda–/– follicle/GC clusters. (F) Volcano plot showing differentially expressed genes between WT cluster 4 and Aicda–/– clusters 1 and 3 (Wilcoxon’s rank sum test adjusted P values < 0.05, absolute log fold change > 0.025). (G and H) Spatial projection of DZ spatial signature (G) and T cell signature (H) total expression in WT and Aicda–/– samples. (IL) Representative photomicrographs of triple IHC staining for DZ Ki-67+ (cyan signal), LZ CD21+ (pink signal), and CD4+ (I) or CD8+ cells (K) (brown signal) and quantitative analyses of the percentage of CD4+ (J) or CD8+ (L) T cells in WT and Aicda–/– GCs (n = 10 WT GCs; n = 10 Aicda–/– GCs). Original magnification, ×400. Scale bars: 50 μm. Statistical analysis: 2-tailed unpaired Mann-Whitney test. Mean ± SEM is shown. (M) Gene set enrichment analysis (GSEA) of DZ spatial signature in AICDA-high and AICDA-low DZ B cells. (N) Pathway enrichment of 257 AICDA-high signature genes using Reactome Pathway library. (O) Pathway enrichment of 127 AICDA-low signature genes using Reactome Pathway library.
Figure 5
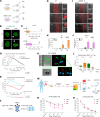
Figure 5. ATRi allows immune permeation of a DZ-like DLBCL in vitro.
(A) Schematic of ATRi treatment (ceralasertib, AZD6738) in HT and SUDHL‑5 cells: cells treated with DMSO or AZD6738 (1 µM) for 48 hours. (B) Representative IF images of HT and SUDHL‑5 nuclei after 1 µM ATRi for 48 hours (green: lamin B1). Arrows indicate micronuclei. Scale bars: 5 µm. (C) Quantification of micronuclei formation (relative to IF analysis in B). (D) GSEA on ATRi and DMSO samples using the MHC and IFN‑γ signature. (E) GSEA on ATRi and DMSO samples using DZ and LZ spatial signatures. (F) Schematic of competitive microfluidic device. PKH26‑labeled PBMCs loaded into the central chamber; HT or SUDHL‑5 cells embedded in Matrigel with ATRi or DMSO and loaded in lateral chambers. (GJ) Visualization and quantification of red fluorescent PBMCs in HT (G and H) and SUDHL‑5 (I and J) chambers at 24 and 48 hours. (G and I) Scale bars: 125 µm. Mean ± SD from 3 replicates using PBMCs from different donors (n = 3). (K) Confocal microscopy of ATRi-treated DLBCL gel chamber at 48 hours. Arrows show interactions between CD3+ (green), PKH26+ (red) T cells and DAPI+ (blue) HT cells. Visible‑light image (left) and Z‑stack (right) shown. Scale bars: 50 µm (top left), 5 µm (bottom left and right). (L) Box plot showing distances between PBMCs and tumor cells in DMSO vs. ATRi chambers, measured in X, Y, Z coordinates in the microfluidic chip. (M) Schematic of experimental protocol. Primary tumor cells from DLBCL PDXs were selected based on spatial gene expression (DZ-like or LZ-like). Tumor cells pretreated with ATRi AZD6738 (1 or 5 µM) were used in T cell–mediated cytotoxicity assays. (N, O) Dose–response curves of T cell–mediated killing across indicated target/effector ratios for DZ-like (N) or LZ-like (O) DLBCL PDX-derived cells treated with 1 or 5 µM ATRi. Statistical analysis was assessed using a 2-tailed unpaired Mann-Whitney test (C, H, J, and L). Values are shown as mean ± SEM; *P < 0.05, **P < 0.01, ****P < 0.0001.
Figure 6
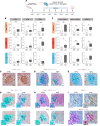
Figure 6. Functional impact of ATRi treatment on GC response.
(A) Schematic representation of experimental protocol. In one experiment on ten C57BL/6J mice, immunization with NP-OVA in alum on day 0, followed by treatment with vehicle (n = 5) or AZD6738 (50 mg/kg, n = 5), was performed from day 2 to day 6. mLNs were harvested on day 7 for analysis. (B) Box plots showing quantitative analysis of CD3+, CD4+, and CD8+ T cell infiltration in indicated numbers of total GCs and DZ and LZ compartments in vehicle-treated (CTRL) versus ATRi-treated mice. (C) Representative photomicrographs of double-marker IHC for Ki-67+ (brown) and CD3+ (pink) cells in mLN GCs from vehicle-treated (CTRL) and ATRi-treated mice. Original magnification, ×400. Scale bars: 50 μm. (D) Combined IHC/IF staining for CD3+ (brown), CD21+ (pink), and Ki-67+ (cyan) cells in mLN GCs from vehicle-treated (CTRL) and ATRi-treated mice, showing spatial distribution of T cells in DZ and LZ compartments. Original magnification, ×400. Scale bars: 50 μm. (E) Combined IHC/IF staining for CD4+ (pink), CD8+ (brown), and Ki-67+ (cyan) cells in mLN GCs from vehicle-treated (CTRL) and ATRi-treated mice, illustrating phenotype of infiltrating T cells. Original magnification, ×400. Scale bars: 50 μm. (F) Box plots showing quantitative analysis of Ifnγ+CD8+ T cells, Ifnb1+CD20+ B cells, and MHC-I expression in indicated numbers of total GCs and DZ and LZ compartments in vehicle-treated (CTRL) versus ATRi-treated mice. (G) Representative images of combined mRNA ISH for Ifnγ (brown) and double-marker IHC for CD8 (pink) and Ki-67 (cyan) in mLN GCs from vehicle-treated (CTRL) and ATRi-treated mice, showing localization of activated CD8+ T cells. Original magnification, ×400 and ×630 (insets). Scale bars: 50 μm and 25 μm. (H) Representative images of combined mRNA ISH for Ifnb1 (brown) and double-marker IHC for CD20 (pink) and Ki-67 (cyan) in vehicle-treated (CTRL) and ATRi-treated mice, highlighting induction of type I interferon response in the DZ. Original magnification, ×400 and ×630 (insets). Scale bars: 50 μm and 25 μm. (I) Representative IHC staining for MHC-I (brown) or MHC-I (brown) and Ki-67 (violet) in vehicle-treated (CTRL) and ATRi-treated mice, demonstrating increased MHC-I expression in the DZ in response to ATR inhibition. Original magnification, ×400 and ×630 (insets). Scale bars: 30 μm. Box plot statistical analysis: 2-tailed unpaired Mann-Whitney test. Mean ± SEM is shown; *P < 0.05, **P < 0.01, ***P < 0.001.

Update of

References

    1. Galassi C, et al. The hallmarks of cancer immune evasion. Cancer Cell. 2024;42(11):1825–1863. doi: 10.1016/j.ccell.2024.09.010. - DOI - PubMed
    1. Robert C. A decade of immune-checkpoint inhibitors in cancer therapy. Nat Commun. 2020;11(1):3801. doi: 10.1038/s41467-020-17670-y. - DOI - PMC - PubMed
    1. Togashi Y, et al. Regulatory T cells in cancer immunosuppression — implications for anticancer therapy. Nat Rev Clin Oncol. 2019;16(6):356–371. doi: 10.1038/s41571-019-0175-7. - DOI - PubMed
    1. Veglia F, et al. Myeloid-derived suppressor cells in the era of increasing myeloid cell diversity. Nat Rev Immunol. 2021;21(8):485–498. doi: 10.1038/s41577-020-00490-y. - DOI - PMC - PubMed
    1. Sangaletti S, et al. Mesenchymal transition of high-grade breast carcinomas depends on extracellular matrix control of myeloid suppressor cell activity. Cell Rep. 2016;17(1):233–248. doi: 10.1016/j.celrep.2016.08.075. - DOI - PubMed

MeSH terms