. 2025 Jul 15;10(16):e193787.
doi: 10.1172/jci.insight.193787. eCollection 2025 Aug 22.

Insights into absence of lymphoma despite fulminant Epstein-Barr virus infection in patients with XIAP deficiency

Affiliations

Insights into absence of lymphoma despite fulminant Epstein-Barr virus infection in patients with XIAP deficiency

Yizhe Sun et al. JCI Insight. .

Abstract

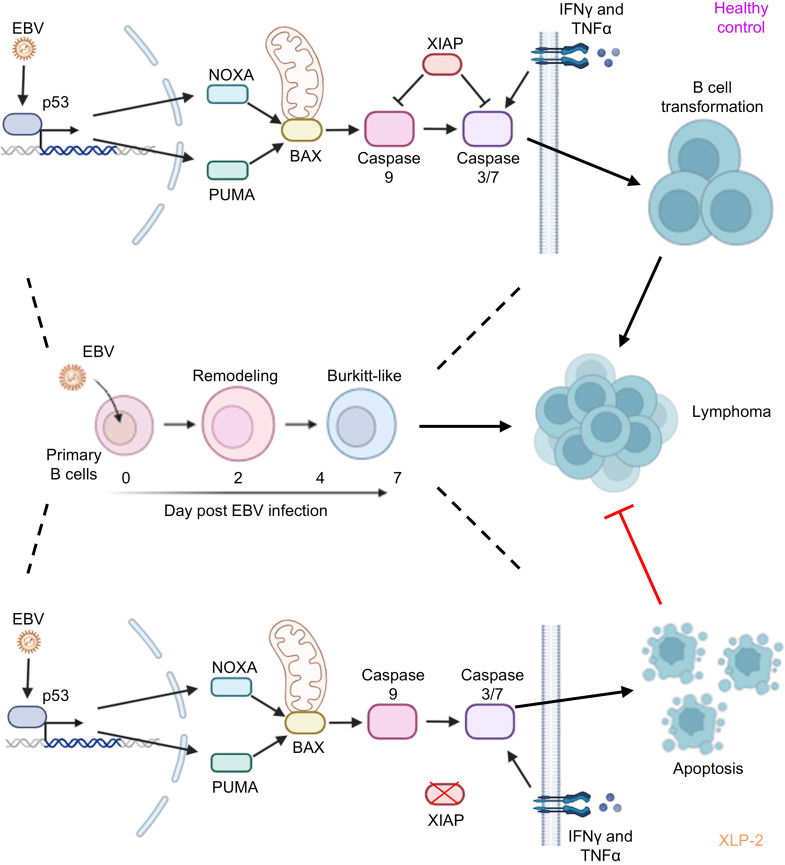
X-linked Lymphoproliferative Syndromes (XLP), arising from mutations in SH2D1A or XIAP genes, are characterized by fulminant Epstein-Barr virus (EBV) infection. Lymphomas occur frequently in XLP-1 and in other congenital conditions with heightened EBV susceptibility, but not in XLP-2. Why XLP-2 patients are apparently protected from EBV-driven lymphomagenesis remains a key open question. To gain insights, newly EBV-infected versus receptor-stimulated primary B cells from XLP-2 patients or with XIAP CRISPR editing were compared with healthy controls. XIAP perturbation impeded outgrowth of newly EBV-infected B cells, but not of CD40 ligand and interleukin-21-stimulated B cells. XLP-2-deficient B cells showed significantly lower EBV transformation efficiency than cells from healthy controls. Interestingly, EBV-immortalized lymphoblastoid cell proliferation was not impaired by XIAP knockout, implicating a XIAP role in early EBV B cell transformation. Mechanistically, nascent EBV infection activated p53-mediated apoptosis signaling, which was counteracted by XIAP in control cells. With XIAP deficiency, EBV markedly elevated apoptosis rates over the first 2 weeks of infection. IFN-γ, whose levels are increased with severe XLP2 EBV infection, markedly increased newly EBV-infected B cell apoptosis. These findings underscored XIAP's crucial role in support of the earliest stages of EBV-mediated B cell immortalization and provide insights into the curious absence of EBV+ lymphoma in patients with XLP-2.

Keywords: Apoptosis; Infectious disease; Lymphomas; Virology.


Conflict of interest statement

Conflict of interest: The authors have declared that no conflict of interest exists.

Figures

Figure 1
Figure 1. XIAP inactivation impairs the outgrowth of newly EBV-infected primary B cells.
(A) Workflow: B cells were electroporated with Cas9 ribonucleoprotein (RNP) complexes containing XIAP targeting or nontargeting control single guide RNA (sgRNA). 1 hour after electroporation, cells were infected with EBV or stimulated by CD40L/IL-21. (B) Immunoblot analysis of whole cell lysates (WCL) from primary B cells on Day 3 after electroporation with Cas9 control or XIAP sgRNA-containing RNPs. (C) FACS analysis of control versus XIAP edited B cells at Day 2 after infection by EBV that expressed a GFP marker. Mean + SD GFP+ cell percentages from n = 3 replicates are shown. (D) Growth curve analysis of primary B cells electroporated with Cas9 RNPs and treated with CD40L/IL-21 or infected with EBV. (E) Immunoblot analysis of WCL from primary B cells transfected with RNP and on the indicated days after EBV infection. (F) Growth curve analysis of EBV+ (left) or CD40L/IL-21 treated (right) primary B cells treated with DMSO or the XIAP inhibitor embelin. (G) Immunoblot and growth curve analysis of Cas9+ GM12878 LCLs expressing control or XIAP-targeting sgRNAs. (H) Growth curve analysis of DMSO or embelin-treated GM12878. (I) Growth curve analysis of primary B cells infected by EBV at Day 0 and treated with embelin as indicated. Statistical significance was assessed by comparing each indicated groups with DMSO-treated control groups. Mean ± SD fold change cell numbers from n = 3 biological replicates, relative to Day 0 values, are shown (D and FI). Blots are representative of n = 3 replicates. Blots of the same samples were run in parallel at the same time under identical conditions (B and E). Embelin (5 μM), CD40L (50 ng/mL) and IL-21 (50ng/mL) were replenished every 3 days (D, F, H, and I). Statistical significance was assessed by 2-tailed unpaired Student’s t test (C, D, F, H, and I) or 1-way ANOVA followed by Tukey’s multiple comparisons test (G). **P < 0.01, ***P < 0.001, ****P < 0.0001.
Figure 2
Figure 2. B cells from patients with XLP-2 demonstrate impaired EBV, but not CD40L/IL-21–driven outgrowth at early timepoints.
(A) Schematic diagram highlighting the XIAP mutation shared by XLP-2 Patient numbers 1 and 2. (B) Growth curve analysis of primary B cells from patients with XLP-2 or people in the control group that were infected with EBV on Day 0. Statistical significance of comparisons between the XLP-2 samples and Control no. 1 are indicated. (C) Growth curve analysis of primary B cells from patients with XLP-2 or controls treated with CD40L and IL-21, which was replenished every 3 days. Statistical significance of comparisons between the XLP-2 samples and Control no. 1 are indicated. (D) Growth curves of lymphoblastoid cells established from B cells from Patients 1 or 2 with XLP-2, or from 3 healthy controls. Statistical significance of comparisons between the XLP-2 samples and Control no. 1 are indicated. (E) EBV B cell transformation assay workflow. CD19+ B cells purified from PBMCs were plated and infected with serial dilutions of the Akata EBV strain, using a range of 0–100 EBV transforming units/well. Wells with B cell outgrowth were scored 4 weeks later. (F) EBV transformation assays of primary human B cells from XLP-2 Patient no. 1 or from 2 healthy controls, as in E. Shown are the mean ± SD percentages of wells with B cell outgrowth from n = 3 replicates. Mean ± SD fold change live cell numbers from n = 3 replicates, relative to Day 0 values, are shown (BD). Statistical significance was assessed by 1-way ANOVA followed by Tukey’s multiple comparisons test (BD, and F). *P < 0.05, **P < 0.01, ***P < 0.001, ****P < 0.0001.
Figure 3
Figure 3. EBV, but not CD40L/IL-21, triggers apoptosis within the first week of XLP-2 B cell infection.
(A) FACS analysis of control versus XIAP-edited primary B cells at Day 4 after EBV infection or CD40L/IL-21 stimulation. Shown are representative FACS plots from n = 3 replicates of cells stained with CFSE on Day 0. Live cells were gated by absence of 7-AAD vital dye uptake. (B) Mean + SD percentages of cells with the indicated number of mitoses from n = 3 replicates of EBV infection versus CD40L/IL-21 stimulation, as in A. (C) Mean + SD % 7AAD+ cells from n = 3 replicates of control or XIAP-edited primary B cells on Day 4 after EBV infection or CD40L/IL21 treatment. (D) Mean + SD caspase 3/7 activity from n = 3 replicates of control or XIAP-edited primary B cells on day 4 after EBV infection or CD40L/IL-21 treatment. (E) Mean + SD caspase 3/7 activity from n = 3 replicates of control or XLP-2 primary B cells on day 4 after EBV infection or CD40L/IL-21 treatment. (F) Mean + SD caspase 3/7 activity from n = 3 replicates of control or XIAP edited primary B cells incubated with DMSO or the pan-caspase inhibitor zVAD-fmk (20 μM) on day 4 after EBV infection or CD40L/IL-21 treatment. (G) Mean + SD % 7AAD+ cells from n = 3 replicates of control or XIAP-edited primary B cells on Day 4 after EBV infection or CD40L/IL21 treatment. (H) Growth curve analysis of control versus XIAP-edited B cells infected with EBV on Day 0 and cultured with DMSO or zVAD-Fmk (20 μM). Mean ± SD fold-change live cell numbers, relative to uninfected values, are shown. Statistical significance was assessed by 2-tailed unpaired Student’s t test (H) or 1- (E) or 2-way (BD, F, and G) ANOVA followed by Tukey’s multiple comparisons test. CD40L (50 ng/mL), IL-21 (50 ng/mL), DMSO and zVAD-Fmk were replenished every 3 days (AH). **P < 0.01, ***P < 0.001, ****P < 0.0001.
Figure 4
Figure 4. EBV but not CD40L/IL-21 activates p53- and BAX-dependent apoptosis in newly infected XIAP-deficient B cells.
(A) RNA-seq analysis of XLP-2 patient or control primary B cells on Day 7 after EBV infection or CD40L/IL-21 treatment. Z-scores of normalized mRNA reads are shown. (B) Proteomic analysis of XLP-2 patient or control primary B cells on Day 7 after EBV infection or CD40L/IL-21 treatment. Unstimulated cells were harvested on Day 0. Z-scores of relative protein abundances are shown. (C) Mean + SD TP53 and BAX mRNA levels from n = 3 replicates of RNA-seq of healthy donor primary B cells on the indicated days after EBV infection (43). (D) p53 target genes PUMA and NOXA can upregulate BAX to activate intrinsic apoptosis. Red stars denote upregulation after EBV infection relative to CD40L/IL-21 levels. (E) Mean + SD caspase 3/7 activity on day 4 after EBV infection from n = 3 replicates of primary B cells electroporated with the indicated Cas9 RNPs and treated with BAI1. (F) Growth curve analysis of control versus XIAP edited primary B cells and cultured with DMSO, zVAD-Fmk, or BAI1 from Day 0 onwards. (G) Immunoblot analysis of WCL from primary B cells on day 3 after electroporation with the indicated Cas9 RNPs. Blots are representative of n = 3 experiments. (H) Mean + SD caspase 3/7 activity on Day 4 after EBV infection from n = 3 replicates of B cells electroporated with Cas9 RNPs, EBV-infected and treated with DMSO or embelin. (I) Growth curve analysis of control versus TP53 edited primary B cells cultured with DMSO or embelin from Day 0 onward. Shown are mean ± SD fold-change cell numbers, relative to uninfected values, from n = 3 replicates (F and I). DMSO, BAI1 (5μM), zVAD-Fmk (20 μM), and embelin (5 μM) were replenished every 3 days (E, F, H, and I). Statistical significance was assessed by 2-tailed unpaired Student’s t test (F and I) or 2-way ANOVA followed by Tukey’s multiple comparisons test (E and H). *P < 0.05, **P < 0.01, ***P < 0.001.
Figure 5
Figure 5. Embelin XIAP inhibition perturbs EBV-mediated primary B cell outgrowth and sensitizes newly infected cells to
IFN-γ–triggered apoptosis. (A) FACS analysis of CD4+ or CD8+ T, CD56+ NK, and CD19+ B cell subsets from PBMCs of a control donor, infected with EBV and treated with DMSO or embelin, on Day 7 after EBV infection. (B) Mean + SD percentages of indicated cell subsets from A are shown. (C) Mean + SD %7-AAD+ cells from n = 3 replicates of DMSO or embelin-treated primary B cells on Day 4 after EBV infection or CD40L/IL21 treatment. (D) FACS analysis of embelin effects on infected B cell proliferation. PBMC cultures were labeled with Cell Trace Violet (CTV, whose levels are diluted by 50% with each cell division) and infected by EBV. Cells were treated with either DMSO or with embelin. CTV levels on CD19+ B cells from the PBMCs were measured on Day 7 after infection. (E) Mean + SD %7 AAD+ cells of primary B cells cultured alone or cocultured with autologous PBMCs and treated with either DMSO or embelin for 4 days. B cells were stained with CFSE as cell trace marker prior to PBMC coculture. (F) Mean + SD caspase 3/7 activity on Day 4 after infection from n = 3 replicates of cells treated with DMSO or embelin and also PBS, IFN-γ, TNF-α, IL-6, or IL-18. (G) Growth curve analysis of EBV-infected primary B cells treated with DMSO or embelin, together with IFN-γ, TNF-α, IL-6, or IL-18. Shown are mean ± SD fold-change live cell numbers from n = 3 replicates. Statistical significance was assessed by comparing each cytokine-treated group with PBS control group. DMSO, embelin (5 μM), and cytokines (all 50 ng/mL) were replenished every 3 days (AG). Statistical significance was assessed by 2-tailed unpaired Student’s t test (B, C, and G) or 2-way ANOVA followed by Tukey’s multiple comparisons test (E and F). *P < 0.05, **P < 0.01, ***P < 0.001, ****P < 0.0001.
Figure 6
Figure 6. Schematic model of key antiapoptotic XIAP role in newly EBV-infected B cells.
EBV drives rapid proliferation of newly infected B cells, which triggers DNA damage, upregulation of p53 and downstream NOXA, PUMA, and BAX. XIAP blocks caspase activity and apoptosis in most settings, including with XLP-1, enabling newly EBV-infected B cells to undergo transformation and in XLP-1 to cause high rates of lymphomas. Lymphomas are not observed in patients with XLP-2, where the absence of XIAP enables p53 and BAX-driven caspase 3/7 activation and apoptosis induction over the first week of EBV infection, which is exacerbated by the inflammatory cytokine milieu, in particular by IFN-γ, restraining lymphomagenesis.

Update of

References

    1. Farrell PJ. Epstein–Barr virus and cancer. Annu Rev Pathol. 2019;14:29–53. doi: 10.1146/annurev-pathmechdis-012418-013023. - DOI - PubMed
    1. Münz C. Latency and lytic replication in Epstein-Barr virus-associated oncogenesis. Nat Rev Microbiol. 2019;17(11):691–700. doi: 10.1038/s41579-019-0249-7. - DOI - PubMed
    1. Cohen JI, et al. The need and challenges for development of an Epstein-Barr virus vaccine. Vaccine. 2013;31 Suppl 2(0 2):B194–B196. doi: 10.1016/j.vaccine.2012.09.041. - DOI - PMC - PubMed
    1. Heslop HE. How I treat EBV lymphoproliferation. Blood. 2009;114(19):4002–4008. doi: 10.1182/blood-2009-07-143545. - DOI - PMC - PubMed
    1. Tangye SG, Latour S. Primary immunodeficiencies reveal the molecular requirements for effective host defense against EBV infection. Blood. 2020;135(9):644–655. doi: 10.1182/blood.2019000928. - DOI - PubMed

MeSH terms

Substances

Supplementary concepts