. 2025 Sep 2;35(9):1975-1991.
doi: 10.1101/gr.279501.124.

Transcriptional modulation unique to vulnerable motor neurons predicts ALS across species and SOD1 mutations

Affiliations

Transcriptional modulation unique to vulnerable motor neurons predicts ALS across species and SOD1 mutations

Irene Mei et al. Genome Res. .

Abstract

Amyotrophic lateral sclerosis (ALS) is characterized by the progressive loss of motor neurons (MNs) that innervate skeletal muscles. However, certain MN groups including ocular MNs, are relatively resilient. To reveal key drivers of resilience versus vulnerability in ALS, we investigate the transcriptional dynamics of four distinct MN populations in SOD1G93A ALS mice using LCM-seq and single-molecule fluorescent in situ hybridization. We find that resilient ocular MNs regulate few genes in response to disease. Instead, they exhibit high baseline gene expression of neuroprotective factors, including En1, Pvalb, Cd63, and Gal, some of which vulnerable MNs upregulate during disease. Vulnerable MN groups upregulate both detrimental and regenerative responses to ALS and share pathway activation, indicating that breakdown occurs through similar mechanisms across vulnerable neurons, albeit with distinct timing. Meta-analysis across four rodent mutant Sod1 MN transcriptome data sets identify a shared vulnerability code of 39 genes, including Atf4, Nupr1, Ddit3, and Penk, involved in apoptosis, as well as a proregenerative and antiapoptotic signature consisting of Atf3, Vgf, Ina, Sprr1a, Fgf21, Gap43, Adcyap1, and Mt1 Machine learning using genes upregulated in SOD1G93A spinal MN predicts disease in human stem cell-derived SOD1E100G MNs and shows that dysregulation of VGF, INA, and PENK is a strong disease predictor across species and SOD1 mutations. Our study reveals MN population-specific gene expression and temporal disease-induced regulation that together provide a basis to explain ALS selective vulnerability and resilience and that can be used to predict disease.


Figures

Figure 1.
Figure 1.
Motor neuron (MN) subpopulations show unique transcriptional profiles but similar levels of ALS disease gene expression. (A) Schematic representation of the study design and laser capture microdissection (LCM) coupled with RNA sequencing (LCM-seq) workflow. We used SOD1G93A mice, a well-established ALS model, and their wild-type (WT) littermates as controls at postnatal day 56 (P56; presymptomatic) and postnatal day 112 (P112; onset of symptoms). LCM was performed to isolate MNs from three cranial nerve (CN) nuclei (CN3/4, CN10, CN12) and the lumbar (L5) spinal cord (SC), followed by Smart-seq2 RNA sequencing for transcriptome analysis. (B) Pairwise Pearson's correlation heatmap of variance-stabilized transformed (VST) gene expression data, showing hierarchical clustering of samples by cell type, genotype, and age. A single linkage method was used for the hierarchical clustering of columns. (C) Principal component analysis (PCA) based on whole-transcriptome expression data highlights clear separation between different MN subtypes, with genotype and age also influencing clustering. (D) Heatmap of key ALS-associated genes (Sod1, Tardp43, Fus, C9orf72, Tbk1, Stmn2, Atxn2), showing no major differences across MN populations. (CN12) Hypoglossal nucleus, (CN10) dorsal motor nucleus of the vagus nerve, (CN3/4) oculomotor and trochlear nuclei.
Figure 2.
Figure 2.
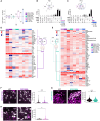
Relatively resistant MNs show little gene dysregulation in response to mutant SOD1. (A) Bar plots of differentially expressed genes (DEGs) across MN populations in SOD1G93A versus WT mice, highlighting a low number of DEGs in CN3/4 compared with other MN populations. Numbers on top and bottom of each bar represent, respectively, the number of up and down DEGs. (B,C) Upset plots of DEGs at P56 and P112, showing the number of genes differentially expressed across CN3/4, CN10, CN12, and SC at different disease stages. Likelihood ratio test, Benjamini–Hochberg adjusted P-value < 0.05. (D) Heatmap showing log fold change (logFC) values of the DEGs across disease stages for CN3/4 at both P56 and P112, showing relatively few significant changes compared with other MN populations. Likelihood ratio test, (**) Benjamini–Hochberg adjusted P-value < 0.01, (*) Benjamini–Hochberg adjusted P-value < 0.05. (E) Heatmaps showing log expression of the DEGs across disease stages for CN10. Likelihood ratio test, (**) Benjamini–Hochberg adjusted P-value < 0.01, (*) Benjamini–Hochberg adjusted P-value < 0.05. (FH) RNAscope images of Chl1 mRNA expression in CN3/4 (n for WT = 376; n for SOD1G93A = 319), CN10 (n for WT = 377; n for SOD1G93A = 206), and CN12 (n for WT = 530; n for SOD1G93A = 508), at P112 with quantification of signal intensity. Scale bars, 30 µm. Permutation test (ns) P > 0.05, (*) P ≤ 0.05, (**) P ≤ 0.01, (***) P ≤ 0.001, (****) P ≤ 0.0001.
Figure 3.
Figure 3.
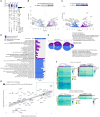
Baseline gene expression in CN3/4 MNs may hold the key to their resilience. (A) Upset plot showing the number of detected genes in CN3/4 and SC in WT mice at P56 and P112. (B) Volcano plot of DEGs at P56 comparing CN3/4 (light purple) versus SC (light blue), highlighting genes enriched in each population. Likelihood ratio test, Benjamini–Hochberg adjusted P-value < 0.05. (C) Volcano plot of DEGs at P112 comparing CN3/4 (purple) versus SC (blue), showing an increased number of DEGs at the symptom-onset stage. Likelihood ratio test, Benjamin–Hochberg adjusted P-value < 0.05. (D) Gene Ontology (GO) term enrichment analysis performed using FGSEA showing enriched GO terms in WT CN3/4 or WT spinal (SC) MNs at P112. (E) Comparison of DEGs and enriched pathways between the mice (Mei_P112 data set) and humans (Allodi et al. 2019). (F) Heatmaps of selected pathways and genes enriched in control CN3/4 MNs in mice and in humans. (G) Scatter plot comparing ALS-induced expression changes in SC (P112) with baseline gene expression differences between CN3/4 and SC, identifying genes that may contribute to CN3/4 resistance. Each dot corresponds to a gene. Genes labeled in bold represent those also identified in the human baseline data set (Allodi et al. 2019). The blue line represents the linear regression of fold changes, with the shaded region showing the 95% confidence interval. Highlighted genes in the green box exhibit higher expression in CN3/4 baseline and are induced in our SC at P112 samples, making them potential candidates for further investigation.
Figure 4.
Figure 4.
Vulnerable MNs show unique regulation of injury response genes. (A) Upset plot showing DEGs in vulnerable populations (CN12 and SC) at P56 and P112. Likelihood ratio test, Benjamini–Hochberg adjusted P-value < 0.05. (B) Heatmap showing logFC expression of shared DEGs between ages in CN12. (C) Heatmap showing logFC expression of common DEGs between CN12 and SC at P112. (D) Heatmap showing logFC expression of common DEGs between ages in SC MNs. (E) Heatmap showing logFC expression of DEGs related to nerve injury response. (B–E) Genes in bold represent DEGs also dysregulated in the work of Saxena et al. (2009). Likelihood ratio test, (**) Benjamini–Hochberg FDR < 0.01, (*) Benjamini–Hochberg FDR < 0.05. Representative RNAscope images with quantification of signal intensity of Atf3 in SC at P56 (n for WT = 407; n for SOD1G93A = 281; F) and P112 (n for WT = 340; n for SOD1G93A = 136; G), Sprr1a in SC at P112 (n for WT = 321; n for SOD1G93A = 218; H), Vgf in SC at P112 (n for WT = 1031; n for SOD1G93A = 704; I), Timp1 in SC at P112 (n for WT = 340; n for SOD1G93A = 136; J), Pvalb in SC at P56 (n for WT = 606; n for SOD1G93A = 523; K), and representative RNAscope image of Fgf21 in SC at P56 (n for WT = 592; n for SOD1G93A = 508; L) and P112 (n for WT = 434; n for SOD1G93A = 258; M). (FM) Scale bars, 30 µm. Permutation test, (ns) P > 0.05, (*) P ≤ 0.05, (**) P ≤ 0.01, (***) P ≤ 0.001, (****) P ≤ 0.0001.
Figure 5.
Figure 5.
Pathway analysis shows a common detrimental response across vulnerable populations. (A,B) GO enrichment dot plots showing significantly enriched pathways that were enriched in at least two of the pathway analysis methods (Fisher test, FGSEA, Anubix) for CN12 and SC at P112. Enrichment scores correspond to the number of functional genes that the method shows being related for the enrichment term. FDR threshold <0.1. (C) Sankey plot showing functional categorization of stress-related genes in CN12 and SC at P112. (D) Functional network analysis on genes shared between CN12 and SC at P112 using Funcoup 5 with all evidence types. Evidence types are the signals that support or contradict the presence of functional coupling. In Funcoup 5, the evidence types included are domain interactions, genetic interaction profile similarity, gene regulation, mRNA coexpression, microRNA regulation, protein coexpression, phylogenetic profile similarity, physical interaction, subcellular localization, and transcription factor binding profile. (E) PCA plot illustrates the clustering pattern of samples based on DEGs belonging to common detrimental pathways (“positive regulation of cell death,” “inflammatory response,” “response to wounding,” “negative regulation of cell death,” “ERK1 and ERK2 cascade”) for CN12 and SC cell types at P112. The top five loading genes for PC1 are highlighted in the plot.
Figure 6.
Figure 6.
Data set comparison and feature selection show a common importance for Vgf in ALS. (A) Overview of the comparison between two data sets: the Namboori et al. (2021) (human) and SC (P112; mouse) data sets. (B) Schematic of the random forest–based machine learning approach for identifying key ALS-relevant genes using upregulated DEGs in SC (P112; n cells selected in Namboori et al. data set: 115). (C) Feature importance ranking from the random forest classifier, highlighting VGF as the most predictive marker. (D) Overview of cross-data set DEG comparison, including work of Shadrach et al. (2021), Lobsiger et al. (2007), Sun et al. (2015), and Namboori et al. (2021). (E) Upset plot showing DEGs shared across ALS data sets. Likelihood ratio test, Benjamini–Hochberg adjusted P-value < 0.05. (F) Heatmap of the 39 common DEGs identified across all mouse studies between SC at P112, Shadrach et al. (2021), Sun et al. (2015), and Lobsiger et al. (2007). Bolded gene names are also predictive in the random forest disease classifier. (G) Heatmap showing common DEGs between all data sets. Colors represent log2(FC); black squares indicate that that gene did not result as a DEG for the relative data set. (H) Representative immunofluorescence image of SC at P112 and showing the expression of VGF protein in VAChT-positive cells. Scale bar, 30 µm. Welch's two-sample t-test P ≤ 2.2 × 10⁻¹⁶. (I) Heatmap displays the 39 ALS-induced DEGs (F) common to four mutant SOD1 MN studies (Mei, Lobsiger, Shadrach, and Sun). Genes are categorized as upregulated or downregulated in ALS MNs. The presence of each gene in different data sets is indicated in columns MEI (disease-induced DEGs shared between CN12 and SC MNs at P112 from Mei et al.) and CRUSH (sciatic nerve crush model from Shadrach et al. 2021), as well as if the regulation is considered “GOOD” or “BAD.” (J) Summary of gene expression and regulation in CN3/4 and spinal (SC) MNs in healthy animals and SOD1-ALS. (Top) CN3/4-enriched genes are involved in ECM remodeling, neuroprotection, and synapse function, with those regulated in ALS highlighted in purple. (Bottom) Gene expression dysregulated in spinal MNs in SOD1-ALS is involved in ECM remodeling, neuroprotection, complement activation, synapse function, axon integrity, ER stress and apoptosis, and axon regeneration. Genes normally enriched in healthy CN3/4 MNs compared with spinal MNs that are induced in spinal MNs with ALS include the neuroprotective genes En1, Fgf21, Mt-Tq, and Pvalb and ECM-related genes.

References

    1. Alexeyenko A, Sonnhammer ELL. 2009. Global networks of functional coupling in eukaryotes from comprehensive data integration. Genome Res 19: 1107–1116. 10.1101/gr.087528.108 - DOI - PMC - PubMed
    1. Allodi I, Comley L, Nichterwitz S, Nizzardo M, Simone C, Aguila Benitez J, Cao M, Corti S, Hedlund E. 2016. Differential neuronal vulnerability identifies IGF-2 as a protective factor in ALS. Sci Rep 6: 25960. 10.1038/srep25960 - DOI - PMC - PubMed
    1. Allodi I, Nijssen J, Aguila Benitez J, Schweingruber C, Fuchs A, Bonvicini G, Cao M, Kiehn O, Hedlund E. 2019. Modeling motor neuron resilience in ALS using stem cells. Stem Cell Reports 12: 1329–1341. 10.1016/j.stemcr.2019.04.009 - DOI - PMC - PubMed
    1. An D, Fujiki R, Iannitelli DE, Smerdon JW, Maity S, Rose MF, Gelber A, Wanaselja EK, Yagudayeva I, Lee JY, et al. 2019. Stem cell-derived cranial and spinal motor neurons reveal proteostatic differences between ALS resistant and sensitive motor neurons. eLife 8: e44423. 10.7554/eLife.44423 - DOI - PMC - PubMed
    1. Baskozos G, Sandy-Hindmarch O, Clark AJ, Windsor K, Karlsson P, Weir GA, McDermott LA, Burchall J, Wiberg A, Furniss D, et al. 2020. Molecular and cellular correlates of human nerve regeneration: ADCYAP1/PACAP enhance nerve outgrowth. Brain 143: 2009–2026. 10.1093/brain/awaa163 - DOI - PMC - PubMed