. 2025 Jul 17;16(1):6577.
doi: 10.1038/s41467-025-61656-7.

Chromatin interaction maps of human arterioles reveal mechanisms for the genetic regulation of blood pressure

Affiliations

Chromatin interaction maps of human arterioles reveal mechanisms for the genetic regulation of blood pressure

Yong Liu et al. Nat Commun. .

Abstract

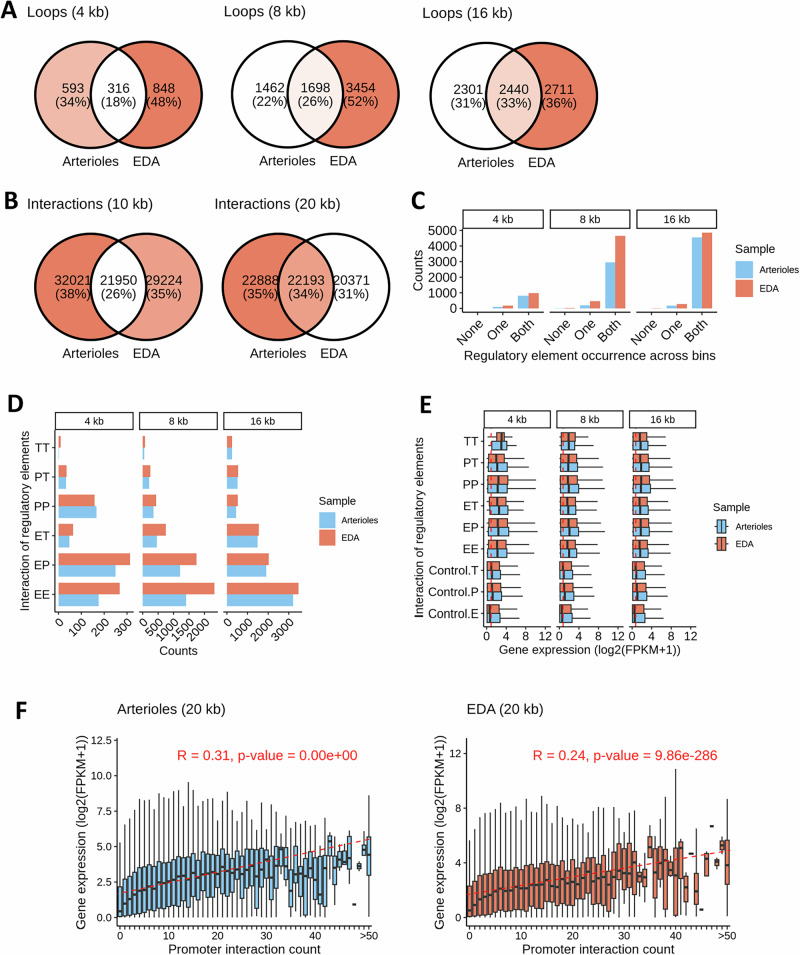
Arterioles are small blood vessels located just upstream of capillaries in nearly all tissues. Despite the broad and essential role of arterioles in physiology and disease, current knowledge of the functional genomics of arterioles is largely absent. Here, we report extensive maps of chromatin interactions, single-cell expression, and other molecular features in human arterioles and uncover mechanisms linking human genetic variants to gene expression in vascular cells and the development of hypertension. Compared to large arteries, arterioles exhibited a higher proportion of pericytes which were enriched for blood pressure (BP)-associated genes. BP-associated single nucleotide polymorphisms (SNPs) were enriched in chromatin interaction regions in arterioles. We linked BP-associated noncoding SNP rs1882961 to gene expression through long-range chromatin contacts and revealed remarkable effects of a 4-bp noncoding genomic segment on hypertension in vivo. We anticipate that our data and findings will advance the study of the numerous diseases involving arterioles.


Conflict of interest statement

Competing interests: The authors declare no competing interests.

Figures

Fig. 1
Fig. 1. The cellular composition and properties of human arterioles exhibit distinct features compared with the aorta.
A UMAP plot showing major cell types identified in arteriole (this study) and thoracic aorta (Pirruccello, J.P. et al., 2022) snRNA-seq data. B Dot plot displaying expression of conventional marker gene across cell types. Dot size represents the percentage of cells expressing each gene, and color intensity indicates the average expression level. C Relative proportions of pericytes to ECs and VSMCs to ECs in arteriole and thoracic aorta, shown separately. D Heatmap showing pairwise gene expression correlations across cell types in arteriole and thoracic aorta, with color indicating Spearman correlation coefficients. E Dot plot showing significant associations between cell types and blood pressure-related traits from MAGMA cell typing analysis. Statistical significance was assessed using a gene set enrichment analysis based on the top 10% most specific genes for each cell type. P-values were adjusted using the Benjamini-Hochberg (BH) method to control the false discovery rate (FDR). Only associations with FDR < 0.05 are shown. Dot size represents the effect size (beta), and color intensity reflects the magnitude of the –log₁₀(p-value). Exact p values are in the Source Data file Cell type. EC endothelial cell, LEC lymphatic endothelial cell, VSMC vascular smooth muscle cell.
Fig. 2
Fig. 2. Chromatin contact regions in human arterioles contain DNA regulatory elements and correlate with greater gene expression.
A Venn diagrams showing the overlap between loops identified in arterioles and EC-denuded arterioles (EDA) by Micro-C at 4 kb, 8 kb, and 16 kb resolutions. B Venn diagrams showing the overlap between interactions identified in arterioles and EDA by pan-promoter Capture Micro-C at 10 kb and 20 kb resolutions. C Bar plot showing the number of loops with regulatory elements present in one or both chromatin contact regions in arterioles and EDA across resolutions. “None,” “one,” and “both” indicate the presence of regulatory elements in neither, one, or both interacting regions, respectively. D Number of chromatin interactions classified by interaction type: promoter-promoter (PP), enhancer-promoter (EP), enhancer-enhancer (EE), enhancer-transcription factor binding site (ET), promoter-transcription factor binding site (PT), and transcription factor binding site-transcription factor binding site (TT). Categories are not mutually exclusive. E Expression levels of genes proximal to chromatin interactions (within 5 kb upstream or downstream of contact regions), grouped by interaction type (PP, EP, EE, ET, PT, TT). Controls include genes proximal to regulatory regions, including promoters, enhancers, or transcription factor binding sites, that were not in contact regions based on our data. Each box summarizes gene-level data. The number of genes (n) per category varies and is provided in the Source Data file. Boxes represent the interquartile range (IQR, 25th to 75th percentile), center line shows the median, and whiskers extend to 1.5 × IQR. F Boxplot showing gene expression levels grouped by the number of chromatin interactions involving gene promoter regions. Spearman correlation was applied. Each box summarizes gene-level data. The number of genes (n) per category is provided in the Source Data file. Boxes represent the IQR (25th to 75th percentile), center line shows the median, and whiskers extend to 1.5 × IQR.
Fig. 3
Fig. 3. Chromatin interactions with gene promoters, DNA methylation, and mRNA abundance of representative genes essential to arteriolar function.
A AGTR1 (Angiotensin II Receptor Type 1). B EDN1 (Endothelin 1). C NOS3 (Nitric Oxide Synthase 3). Linux-based IGV was used to plot chromatin interactions based on pan-promoter capture Micro-C, RNA abundance based on poly(A)-dependent RNA-seq, and methylation levels based on RRBS. Only chromatin interactions with the promoter of the gene of interest are shown. The chromatin contact regions were compared with the regulatory elements as defined by Ensembl for overlaps. E enhancer, T transcriptional factor binding site, C CCCTC-binding factor (CTCF) binding site, O open chromatin region.
Fig. 4
Fig. 4. Chromatin contact regions in human arterioles are enriched for SNPs associated with blood pressure and stroke.
A Bar plot showing the percentage of SNPs covered by Micro-C or pan-promoter Capture Micro-C in arterioles and EDA, grouped by arteriole-related traits. Red dashed lines indicate the average SNP coverage across non-arteriole-related traits (Methods). One-sided binomial test; no multiple testing correction. B Bar plot of BP-associated SNPs density within 1 Mb contact regions in our Micro-C datasets compared to Hi-C from the tibial artery and aorta (ENCODE). Red dashed line represents average SNP density in Hi-C. C Venn diagrams showing overlap of SNP-gene pairs identified by chromatin interactions and GTEx artery eQTLs (aorta, tibial, coronary). Two-sided Fisher’s exact test against all arteriolar trait-associated SNPs linked to genes within ±2 Mbp; unadjusted p-values. D Bar plot of SNP-gene interaction distances, binned by distance categories. Only SNPs from arteriole-related traits (see A) are included. E Pathway enrichment of genes interacting with arteriole-related SNPs in pan-promoter Capture Micro-C, shown for arteriole and EDA. BH method applied for FDR correction. F Schematic of SNP-gene interaction patterns by SNP bin location (promoter vs. distal), with interaction counts in arterioles and EDA. G Percentage of covered SNPs by regulatory elements (promoter vs. distal). Red dashed lines represent overall SNP coverage. Two-sided Fisher’s exact test with BH correction; only significant enrichments with odds ratio > 1 are marked with asterisks. Rank plot of genes significantly upregulated in ECs (H) and fibroblasts (I) compared to all other cell types (one-sided Wilcoxon test; Bonferroni-corrected p-value < 0.05). Genes involved in SNP-promoter interactions are colored by occurrence. Enhancer SNP-promoter targets are highlighted with red circles. Top 10 SNP-gene pairs are labeled. J UMAP plots showing the expression of selected enhancer SNP-linked genes (ERG, FBLN5, SEMA4A and PDGFRA) across arterioles cell types (snRNA-seq data). Statistical significance is indicated as follows: *p < 0.05, **p < 0.01, and **p < 0.001. Exact p values are in the Source Data file.
Fig. 5
Fig. 5. BP-associated noncoding SNP rs1882961 interacts with NRIP1 promoter 119 kbp away and influences NRIP1 expression.
A Prioritization of SNP-gene pairs for experimental analysis. B The genomic region containing rs1882961 interacted with NRIP1 promoter 119 kbp away from it in human endothelium-denuded arterioles, based on pan-promoter capture Micro-C analysis. C Local gene organization around rs1882961 in the human genome. D Deletion of DNA segment containing rs1882961. 39b, original iPSC cell line; X33 and X85, rs1882961-deleted cell lines. E Reconstitution of the rs1882961 locus containing either homozygous low BP allele or high BP allele. 39b, original iPSC cell line; X85, rs1882961-deleted cell line; Y series, cell lines with reconstituted low-BP rs1882961 allele; Z series, cell lines with reconstituted high-BP rs1882961 allele. See Supplementary Fig. S8 for sequence confirmation. F Homozygous high-BP allele of rs1882961, reconstituted in hiPSCs, increased NRIP1 and SAMSN1 expression in isogenic hiPSC-derived vascular smooth muscle cells (iVSMCs). Each line of hiPSCs was differentiated to iVSMCs in five independent rounds with three independent wells in each round, with each well considered a replicate. For SAMSN1 and NRIP1 expression, N = 13 for low BP and N = 15 for high BP; for USP25, N = 15 for low BP and N = 15 for high BP; Data are presented as Mean ± SEM. *, p = 0.0095 for SAMSN1 and p = 0.0371 for NRIP1 -, two-tailed unpaired t-test. G Region-capture Micro-C analysis showed greater chromatin interactions between the rs1882961 region and the promoters of SAMSN1 and NRIP1 in iVSMCs with the high-BP allele of rs1882961, compared to iVSMCs with the low-BP allele. Each square color box in the zoom-in images is 5 kbp x 5 kbp.
Fig. 6
Fig. 6. Deletion of a 4-bp noncoding genomic segment containing the rs1882961 orthologous site attenuates salt-induced hypertension in the Dahl salt-sensitive (SS) rat.
A Comparative mapping and deletion of a 4-bp rat genomic segment containing the rs1882961 orthologous site. See Supplementary Fig. S11 for additional detail and confirmation of deletion. The image at the top was generated using the UCSC Genome Browser, http://genome.ucsc.edu. The deletion of the 4-bp noncoding genomic segment in the SS rat attenuated salt-induced hypertension (BG). B Mean arterial pressure (MAP). C Systolic blood pressure (SBP). D Diastolic blood pressure (DBP). E Pulse pressure. F Heart rate. G Hourly averages of MAP on days 12 to 14 on a 4% NaCl high salt diet. WT wild-type littermate SS rats, Δrs961 SS-Δrs1882961−/− rats. For BG, n = 7 for WT and 8 for Δrs961. Data are presented as mean ± SEM. #, p < 0.05, ##, p < 0.01 for WT vs. Δrs961 by two-way RM ANOVA; *, p < 0.05 vs. WT by Holm-Sidak test. H Nrip1 expression in the mesentery was lower in SS-Δrs1882961−/− rats compared to WT. In normal salt, n = 7 for WT and n = 9 for Δrs961; in high salt, n = 4 for WT and n = 5 for Δrs961. Data are presented as Mean ± SEM. *, p < 0.05, Two-way ANOVA followed by Holm-Sidak test. I Vascular smooth muscle sensitivity to nitric oxide (NO) in the 3rd order mesenteric artery was improved in SS-Δrs1882961−/− rats compared to WT. Spermine NONOate, an NO donor. N = 6 for WT and 7 for Δrs961 rats. Data are presented as mean ± SEM. ##, p < 0.001 for WT vs. Δrs961; *, p < 0.001 for 10-7 and 10-6 M and p = 0.019 for 10-5 M; two-way RM ANOVA, followed by Holm-Sidak test.

Update of

References

    1. Rahman, M. & Siddik, A. B. Anatomy, Arterioles. In StatPearls. StatPearls Publishing (2023). - PubMed
    1. Martinez-Lemus, L. A. The dynamic structure of arterioles. Basic Clin. Pharm. Toxicol.110, 5–11 (2012). - PMC - PubMed
    1. Tykocki, N. R., Boerman, E. M. & Jackson, W. F. Smooth muscle ion channels and regulation of vascular tone in resistance arteries and arterioles. Compr. Physiol.7, 485–581 (2017). - PMC - PubMed
    1. Kato, M. & Natarajan, R. Diabetic nephropathy–emerging epigenetic mechanisms. Nat. Rev. Nephrol.10, 517–530 (2014). - PMC - PubMed
    1. Touyz, R. M., Montezano, A. C., Rios, F., Widlansky, M. E. & Liang, M. Redox stress defines the small artery vasculopathy of hypertension: how do we bridge the bench-to-bedside gap?. Circ. Res.120, 1721–1723 (2017). - PMC - PubMed

LinkOut - more resources