. 2025 Jul 17;16(1):6578.
doi: 10.1038/s41467-025-61780-4.

The tumor-sentinel lymph node immuno-migratome reveals CCR7⁺ dendritic cells drive response to sequenced immunoradiotherapy

Affiliations

The tumor-sentinel lymph node immuno-migratome reveals CCR7⁺ dendritic cells drive response to sequenced immunoradiotherapy

Robert Saddawi-Konefka et al. Nat Commun. .

Abstract

Surgical ablation or broad radiation of tumor-draining lymph nodes can eliminate the primary tumor response to immunotherapy, highlighting the crucial role of these nodes in mediating the primary tumor response. Here, we show that immunoradiotherapy efficacy is dependent on treatment sequence and migration of modulated dendritic cells from tumor to sentinel lymph nodes. Using a tamoxifen-inducible reporter paired with CITE-sequencing in a murine model of oral cancer, we comprehensively characterize tumor immune cellular migration through lymphatic channels to sentinel lymph nodes at single-cell resolution, revealing a unique immunologic niche defined by distinct cellular phenotypic and transcriptional profiles. Through a structured approach of sequential immunomodulatory radiotherapy and checkpoint inhibition, we show that sequenced, lymphatic-sparing, tumor-directed radiotherapy followed by PD-1 inhibition achieves complete and durable tumor responses. Mechanistically, this treatment approach enhances migration of activated CCR7+ dendritic cell surveillance across the tumor-sentinel lymph node axis, revealing a shift from their canonical role in promoting tolerance to driving antitumor immunity. Overall, this work supports rationally sequencing immune-sensitizing, lymphatic-preserving, tumor-directed radiotherapy followed by immune checkpoint inhibition to optimize tumor response to immunoradiotherapy by driving activated dendritic cells to draining sentinel lymph nodes.


Conflict of interest statement

Competing interests: The authors declare no competing interests.

Figures
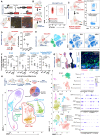
Fig. 1
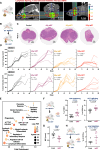
Fig. 1. Host antitumor surveillance is defined by a diverse immunomigratome to the sentinel lymph node.
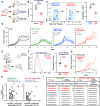
A Cartoon schema for genetically engineered reporter animal model: the R26-CreERT2 x Ai9 reporter mice, which express tdTomato fluorescent protein upon tamoxifen induction. The schematic illustrates the genetic strategy for Cre-mediated tdTomato expression in these mice. Mice were dosed with tamoxifen at 100 mg per kg (body weight) intraperitoneally. Representative immunofluorescence images show increased tdTomato+ cells in the spleen from tamoxifen-treated spleen 72 hours after systemic delivery of tamoxifen. Representative of n = 3 biologically independent samples; experiment was independently repeated at least twice with similar results. B (left) Cartoon schema illustrating the experimental model in which tamoxifen was injected intraorally 0.05 mg in 2.5 μL for intratumoral injection, followed by partial glossectomy after 2 hours and then delayed sentinel lymph node harvest after 48 hours. (right) Flow cytometry analysis of sentinel lymph nodes from locally dosed tamoxifen in the tongues of R26-CreERT2 x Ai9 reporter animals that were treated with either sham surgery or partial glossectomy, showing tdTomato+ CD45+ cells. This demonstrates a lack of tdTomato+ cells in SLN at 48 h after delayed partial glossectomy 2 hours after injection, indicating a lack of tamoxifen diffusion into SLN. Representative of n = 3 biologically independent samples; experiment was independently repeated at least twice with similar results. C (left) Cartoon schema for experimental model in which the sentinel lymphatic channel was interrupted in e8i-CreERT2 x Ai9 reporter animals in which local inflammation was modeled in the oral cavity with injection of Ovalbumin and STING agonist, delivered concurrently with local tamoxifen. Animals then underwent either sham surgery or surgical ablation of the sentinel lymphatic channel 72 hours later, and SLNs were harvested 48 hours after surgery to assess tdTomato+ CD8 + T cell trafficking. (right) Flow cytometry of sentinel lymph nodes from locally dosed tamoxifen in the buccal space of e8i-CreERT2 x Ai9 reporter animals that were treated with either sham surgery or sentinel lymphatic channel ablation in the context of local oral inflammation. Interruption of the afferent lymphatic channel to the SLN was sufficient to block the trafficking of CD8 T cells in e8i-CreERT2 x Ai9 reporter animals. Representative of n = 4 biologically independent samples; the experiment was independently repeated at least twice with similar results. D Quantification of live tdTomato+ cells in SLNs, non-SLNs, and spleen of tamoxifen-treated mice, showing the highest presence in SLNs. Tumor-bearing mice were dosed with 0.05 mg tamoxifen in 2.5 μL miglyol intratumorally followed by tissue harvest for flow cytometry 72 hours after delivery of tamoxifen. Data are presented as mean values ± SEM (n = 4 biologically independent samples/group); p values calculated by two-sided unpaired Student’s t test. E (left) Cartoon schema illustrating the experimental model in which tamoxifen was injected intraorally into 4MOSC1 tumor-bearing R26-CreERT2 x Ai9 reporter mice, followed by sentinel lymph node harvest at 72 hours. (right) tSNE clustering of tdTomato+ CD45+ immune cells from SLNs versus nSLNs shows a compositionally distinct population in the SLN; tSNE, t-distributed stochastic neighbor embedding, was used for dimensionality reduction and visualization of immune cell populations (see methods). Representative of n = 7 biologically independent samples; the experiment was independently repeated at least twice with similar results. F Quantification of tdTomato+ immune cell subsets from SLNs, nSLNs, and axillary lymph nodes in 4MOSC1 tumor-bearing R26-CreERT2 x Ai9 reporter mice, harvested 72 hours after intratumoral tamoxifen injection. Selective enrichment of B cells, dendritic cells, MHCIIhi activated dendritic cells, and progenitor-exhausted CD8 + T cells is observed in SLNs. Data are presented as mean values ± SEM (n = 7 biologically independent samples/group); p values calculated by two-sided unpaired Student’s t test. G Following intratumoral injection of with 0.05 mg tamoxifen in 2.5 μL miglyol, tdTomato+ cells were tracked from the tumor site to the SLNs. Tissues were harvested for analysis at 48 hours following local delivery of tamoxifen. (Top) Cartoon schema and representative H&E and immunofluorescence images of en bloc resected tumor, afferent lymphatic, and sentinel lymph node specimen; (bottom) Representative immunofluorescence imaging of the lymphatic channel and SLNs with tdTomato+ cells tracking along lymphatic vessels adjacent to the SLN. Representative of n = 4 biologically independent samples; the experiment was independently repeated at least twice with similar results. H The Cancer Immunomigratome. 4MOSC1-tumor bearing animals were injected intratumorally with 0.05 mg tamoxifen in 2.5 μL Miglyol 10 days after tumor transplantation, followed by sentinel lymph node mapping and harvest 72 hours after delivery of tamoxifen. Subsequently, CITE-sequencing was performed on tdTomato+ cells isolated from SLNs to characterize immune cell populations involved in antitumor surveillance. UMAP clustering revealed a diverse immunomigratome, including distinct populations of CD4 + T cells, CD8 + T cells, B cells, dendritic cells, NK cells, and other immune cells. Nested pie chart shows the relative abundance of each major migratory population as a percent of the total. n = 2 biologically independent samples/group. I UMAP subclustering and dot plots of tdTomato+ B cells, CD8 + T cells, and CD4 + T cells from SLNs 72 hours after intratumoral tamoxifen injection from H above. Expression patterns of canonical surface markers support classification of migratory immune subsets as defined in the figure. n = 2 biologically independent samples/groupCreated in BioRender. Saddawi-Konefka, R. (2025) https://BioRender.com/emood6a, https://BioRender.com/9yg4is9, https://BioRender.com/m675tdd. Source data are provided as a Source Data file.
Fig. 2
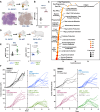
Fig. 2. Tumor-directed, non-cytotoxic radiation promotes local immunosurveillance in the tumor microenvironment.
A (left) Cartoon schema of tumor-directed radiation therapy. (right) Representative CT images of sagittal, coronal, and axial series overlaid with radiation planning. Animals were anesthetized with isoflurane and positioned within the small animal radiotherapy machine. A spiral CT scan with 1 mm cuts of the neck was obtained, and cervical lymphatics were delineated as the planning target volume. A 5 mm collimator was installed, and two static parallel opposed beams were used to deliver homogenous single fraction doses to the planned target volume. Representative of n = 10 biologically independent samples; the experiment was independently repeated at least twice with similar results. B Cartoon schema of the experimental approach. WT animals were injected with 4MOSC1 and then treated with tdRT on day 6. C Representative H&E staining of tumor sections from control and tdRT-treated groups (4 Gy, 8 Gy, 12 Gy tdRT) at week 3 post-treatment. Tumor samples were fixed in zinc formalin fixative and sent for embedding, sectioning, and H&E staining. Slides were analyzed using QuPath software. Representative of n = 3 biologically independent samples; experiment was independently repeated at least twice with similar results. D Tumor growth curves for control and tdRT-treated groups (4 Gy, 8 Gy, 12 Gy tdRT) from 4MOSC1- and 4MOSC2-tumor bearing animals (top and bottom, respectively). Tumor volumes were measured over time, with significant differences observed at specific time points (n = 6 mice per group for Control, 6 mice for 4 Gy, 6 mice for 8 Gy, and 6 mice for 12 Gy, p = ns for 4 Gy, p < 0.0001 for 8 Gy and 12 Gy). p values calculated by two-sided unpaired Student’s t-test. Best-fit lines and p values calculated by simple linear regression (two-sided). E Pathway enrichment analysis of immune-related gene expression changes in tumors following tdRT. Key pathways include chemokine response, myeloid leukocyte migration, and regulation of inflammatory response. Tumors were harvested, and RNA was isolated using Qiagen RNeasy Mini Columns. Library preparation and paired-end RNA sequencing were performed by Novogene. Gene set enrichment analysis was conducted using the GSEAPreranked module on the GenePattern public server, with the Gene Ontology (Biological Processes) and ImmunesigDB gene set collections used. X-axis represents gene sets ranked by normalized enrichment score (NES); Y-axis represents the −log₁₀(FDR q-value). F (left) Cartoon schema of the experimental approach. WT animals injected with 4MOSC1 and then treated with tdRT on day 6 followed by tumor harvest on day 10. (right) Flow cytometric analysis of trafficking CXCR3 + CD8 + T cells and migratory MHCII + CCR7+ dendritic cell (DC) populations in the TME post-tdRT. Quantification is shown (n = 8–10 biologically independent samples per group, p = 0.0046 for CD8 + T cells, p = 0.0198 for DCs). Tumors were isolated, minced, and processed into single-cell suspensions using the Tumor Dissociation Kit and gentleMACS Octo Dissociator. Flow cytometry was performed using fluorochrome-conjugated antibodies. Data are presented as mean values ± SEM; p values calculated by two-sided unpaired Student’s t-test. G CD47 expression on tumor cells post-tdRT, measured by flow cytometry and shown as normalized median fluorescence intensity (MFI) on live CD45- cells (n = 9 biologically independent samples per group, p = 0.0013). Data are presented as mean values ± SEM; p values calculated by two-sided unpaired Student’s t test. H (left) Cartoon schema of the experimental approach. WT animals injected with 4MOSC1-LucOS (ovalbumin expressing) and then treated with tdRT on day 6 followed by tumor harvest on day 10. (right) Flow cytometric analysis of H-2Kb-SIINFEKL expressing antigen-presenting cells post-tdRT. Quantification of normalized populations is shown (n = 7 biologically independent samples per group, p = 0.0397). Tumors were processed as described above, and flow cytometry was performed using H-2Kb-SIINFEKL specific antibodies. Data are presented as mean values ± SEM; p values calculated by two-sided unpaired Student’s t-test. Created in BioRender. Saddawi-Konefka, R. (2025) https://BioRender.com/m675tdd. Source data are provided as a Source Data file.
Fig. 3
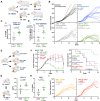
Fig. 3. Tumor-directed radiation upregulates programs of antitumor immune surveillance to potentiate the αPD-1 ICI tumor response.
A (left) Cartoon schema of the experimental approach. WT animals injected with 4MOSC1 tumors were treated with tdRT on day 6. (right) Representative H&E and PD-L1 staining of tumor sections post-tdRT treatment. Combined Positive Score (CPS) for PD-L1 staining was 40.6. Tumor samples were fixed in zinc formalin fixative, embedded, sectioned, and stained. Immunohistochemistry for PD-L1 was performed using an anti-PD-L1 antibody, and CPS was calculated based on the ratio of PD-L1-positive cells to total viable tumor cells. Representative of n = 4 biologically independent samples; the experiment was independently repeated at least twice with similar results. B Quantification of PD-L1 expression on tumor cells post-tdRT, measured by flow cytometry, shown as normalized median fluorescence intensity (MFI) on live CD45− cells (n = 4 mice per group, p = 0.0237). Tumors were isolated, processed into single-cell suspensions, and stained with fluorochrome-conjugated anti-PD-L1 and CD45 antibodies. Flow cytometry was performed to assess PD-L1 expression levels. Data are presented as mean values ± SEM (n = 4 biologically independent samples/group); p values calculated by two-sided unpaired Student’s t test. C Pathway enrichment analysis of immune-related gene expression changes in tumors following tdRT→αPD-1 ICI, highlighting significant upregulation in pathways involved in antigen processing and presentation, phagocytosis, and T cell activation. Tumors were harvested, RNA was isolated, and RNA sequencing was performed. Gene set enrichment analysis was conducted using GSEAPreranked module on the GenePattern public server. X-axis represents gene sets ranked by normalized enrichment score (NES); Y-axis represents the −log₁₀(FDR q-value). D Cartoon schema of the experimental approach. WT animals injected with 4MOSC1 tumors were treated with tdRT on day 6 and subsequently treated with αPD-1 on day 8 or 10. E Cytokine analysis with normalized quantification of IFNγ and IFNβ levels shows significant increases in the tdRT→αPD-1 group compared to the αPD-1 only group (n = 4–5/group; p = 0.0453 for IFNγ, p = 0.0246 for IFNβ). Data are presented as mean values ± SEM (n = 5 biologically independent samples/group); p values calculated by two-sided unpaired Student’s t-test. F Tumor growth curves in 4MOSC1 and 4MOSC2-tumor bearing animals treated with αPD-1 or tdRT followed by αPD-1 (left and right, respectively). Left panels show control (0/10 responders) and αPD-1 treated groups (4/9 responders for 4MOSC1, p = 0.0156; 2/10 responders for 4MOSC2, p = 0.0156). Right panels show tdRT (0/10 responders) and tdRT followed by αPD-1 treated groups (8/10 responders for 4MOSC1, p < 0.0001; 7/10 responders for 4MOSC2, p < 0.0001). The data indicate that the combination therapy leads to a significantly higher response rate and tumor regression compared to αPD-1 alone. Best-fit lines and p values calculated by simple linear regression (two-sided). Created in BioRender. Saddawi-Konefka, R. (2025) https://BioRender.com/m675tdd. Source data are provided as a Source Data file.
Fig. 4
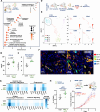
Fig. 4. The host response to sequenced, tumor-directed immunoradiotherapy is coordinated in regional lymphatics.
A Cartoon schema of the experimental approach. WT animals bearing 4MOSC1 tumors were treated with αPD-1 on days 6 and 8 (αPD-1 alone); αPD-1 on days 6 and 8 followed by tdRT on day 10 (αPD-1 → tdRT); or tdRT on day 6 followed by αPD-1 on days 8 and 10 (tdRT→αPD-1). B Tumor growth curves from 4MOSC1-tumor bearing animals treated with αPD-1 alone, αPD-1 followed by tdRT (αPD-1 → tdRT) or tdRT followed by αPD-1 (tdRT → αPD-1). tdRT → αPD-1 sequence demonstrated significantly enhanced tumor control compared to αPD-1 alone and other sequencing strategies (n = 10 mice per group, p < 0.0001 for tdRT → αPD-1 vs αPD-1). Best-fit lines and p values calculated by simple linear regression (two-sided). C Quantification of tumor-infiltrating, antigen-specific CD8 + T cells (TCRβ + OT1 Tetramer + ) across treatment groups. tdRT → αPD-1 therapy significantly increased the proportion of tetramer+ CD8 + T cells compared to αPD-1 → tdRT (n = 9 mice per group, p = 0.0008). Data are presented as mean values ± SEM; p values calculated by two-sided unpaired Student’s t test. D Quantification of cross-presenting APCs (H-2Kb-SIINFEKL + ) in sentinel lymph nodes across treatment groups. tdRT → αPD-1 therapy significantly increased SIINFEKL presentation compared to αPD-1 → tdRT (n = 9 mice per group, p = 0.0027). Data are presented as mean values ± SEM; p values calculated by two-sided unpaired Student’s t test. E (left) Cartoon schema of the experimental approach. WT animals injected with 4MOSC1 tumors were treated with various combinations of tumor-directed radiation and αPD-1 therapy: tdRT→αPD-1, elective nodal irradiation (ENI) + tdRT→αPD-1, and neck dissection (ND) + tdRT→αPD-1. Tumor-directed radiation therapy was delivered using the SmART-Plan system with a 5 mm collimator, and a single fraction of 4 Gy directed to the tumor or tumor and draining lymphatics (ENI) was administered as described in the methods. F (left) Tumor growth curves for control and different treatment groups (tdRT→αPD-1, ENI + tdRT→αPD-1, ND + tdRT→αPD-1) (n = 10 mice per group, p < 0.0001). (right) Overall survival curves for the same treatment groups showing significant differences (p = 0.0015 for tdRT→αPD-1 vs control, p = 0.0252 for ENI + tdRT→αPD-1 vs tdRT→αPD-1, p = 0.0037 for ND + tdRT→αPD-1 vs tdRT→αPD-1). Data are presented as mean values ± SEM. Best-fit lines and p values calculated by simple linear regression (two-sided). G (left) Cartoon schema of the experimental approach for measuring CXCL10 levels. WT animals injected with 4MOSC1 tumors were treated with tdRT→αPD-1. (right) Quantification of CXCL10 levels in the TME post-treatment (n = 5 mice per group, p = 0.0582). CXCL10 levels were measured using a mouse chemokine array on tissue homogenates from treated tumors. Data are presented as mean values ± SEM; p values calculated by two-sided unpaired Student’s t test. H Flow cytometric analysis of CD8 T cell infiltration in the TME post-treatment (n = 5 mice per group, p = 0.0432). Tumors were processed into single-cell suspensions, stained with fluorochrome-conjugated anti-CD8 antibodies, and analyzed by flow cytometry. Data are presented as mean values ± SEM; p values calculated by two-sided unpaired Student’s t test. I Tumor growth curves for tdRT→αPD-1 combined with FTY720 (left) and αCD8 (right) (n = 7 mice per group, not significant). FTY720 (Cayman 10006292) 5 mg/kg/day IP was administered to inhibit lymphocyte egress from lymph nodes, and αCD8 antibodies (BioXCell, clone YTS169.4) 250 mg/mouse/dose IP were used for CD8 depletion every other day. Best-fit lines and p values calculated by simple linear regression (two-sided). Created in BioRender. Saddawi-Konefka, R. (2025) https://BioRender.com/m675tdd. Source data are provided as a Source Data file.
Fig. 5
Fig. 5. Tumor-directed immunoradiotherapy enhances dendritic cell antitumor surveillance across the tumor and sentinel lymph node.
A Cartoon schema of the experimental approach. WT animals injected with 4MOSC1 tumors were treated with tdRT→αPD-1 and then subjected to sentinel lymph node (SLN) mapping. RNA sequencing from the sentinel lymph node showing normalized enrichment scores for various immune response pathways post-treatment. X axis represents gene sets ranked by normalized enrichment score (NES); Y-axis represents the −log10(FDR q value). B ELISA quantification of CCL19 levels in the TME post-treatment (n = 5 mice per group, p = 0.0008). Data are presented as mean values ± SEM (n = 5 biologically independent samples/group); p values calculated by two-sided unpaired Student’s t test. C Flow cytometric analysis of activated dendritic cells (MHCII+ CD11c + CCR7 + ) in the SLN post-treatment (n = 5 mice per group, p = 0.0432). Data are presented as mean values ± SEM; p values calculated by two-sided unpaired Student’s t test. D Cartoon schema of the experimental approach. ROSA-26 x Ai9 animals were injected with 4MOSC1 tumors were treated with tdRT→αPD-1, labeled with tamoxifen in the tumor and then subjected to sentinel lymph node (SLN) mapping. Sorted live tdTomato+ cells from the SLN were then sent for CITE-sequencing. CITE-sequencing was performed on sorted tdTomato+ cells isolated from the SLNs, as described in the methods. n = 2 biologically independent samples/group. E (left) Subsampled dendritic cell populations after CITE-sequencing, showing UMAP plots with clusters of dendritic cells (right) Seurat objects featuring the expression of CCR7, CD40, CD86, and MHCII across DC populations. UMAP clustering and Seurat object analysis were conducted on the CITE-sequencing data to identify dendritic cell subpopulations. F Multiplex immunofluorescence from sentinel lymph nodes showing CD11c, CCR7, CD11b, CD40, and DAPI staining in control and tdRT-treated groups. Representative of n = 3 biologically independent samples; experiment was independently repeated at least twice with similar results. G Analysis of average expression from the DC-3 population showing activation in programs of DC migration, phagocytosis, antigen processing and presentation, and interferon signaling pathways. Representative of n = 2 biologically independent samples. H Flow cytometric analysis of conventional dendritic cells (cDC1, MHCII + XCR1 + ) in the SLN post-treatment (n = 5 mice per group, p = 0.0398). Data are presented as mean values ± SEM; p values calculated by two-sided unpaired Student’s t test. I (left) Cartoon schema of the experimental approach for Batf3−/− animals, which lack conventional type I dendritic cells. (right) Tumor growth curves for control and tdRT→αPD-1 treatment in Batf3−/− animals (n = 5 mice per group, p = ns). Data are presented as mean values ± SEM (n = 5–6 biologically independent samples/group). Best-fit lines and p values calculated by simple linear regression (two-sided). Created in BioRender. Saddawi-Konefka, R. (2025) https://BioRender.com/m675tdd. Source data are provided as a Source Data file.
Fig. 6
Fig. 6. CCR7+ dendritic cell trafficking and MMP9-dependent entry into the sentinel lymph node are critical for immunoradiotherapy efficacy.
A (left) Cartoon schema of the experimental approach. WT animals injected with 4MOSC1 tumors were treated with tdRT→αPD-1 with or without sentinel lymph node lymphatic channel ablation (SLN LCA) or non-sentinel lymph node lymphatic channel ablation (nSLN LCA). SLN LCA and nSLN LCA procedures were performed as described in the methods, involving precise surgical ablation of lymphatic channels. B Flow cytometric analysis of dendritic cell percentages in the sentinel lymph node post-treatment (n = 5 mice per group, p = 0.0379). Data are presented as mean values ± SEM; p values calculated by two-sided unpaired Student’s t test. C Flow cytometric analysis of Ovalbumin-specific T cells (4MOSC1-LucOS model) in SLN and nSLN with and without SLN LCA (left). Quantification of normalized percentages relative to control (right) (n = 4 mice per group, p = 0.0054). Data are presented as mean values ± SEM; p values calculated by two-sided unpaired Student’s t test. D Tumor growth curves for control, tdRT→αPD-1, nSLN LCA + tdRT→αPD-1, and SLN LCA + tdRT→αPD-1 groups (n = 10 mice per group, p < 0.0001). Best-fit lines and p values calculated by simple linear regression (two-sided). E (left) Cartoon schema of the experimental approach. WT animals injected with 4MOSC1 tumors were treated with tdRT→αPD-1 and MMP9 inhibitor. (right) CCR7 expression on dendritic cells and quantification of normalized percentages relative to control (n = 5 mice per group, p = 0.0022). MMP9 inhibition was achieved using a specific inhibitor (Sigma 444293) at 0.4 mg/mouse/dose delivered intratumorally in 8 μL volume on post-transplant day 3, 5 and 7, as previously described,. SLN were mapped and harvested 48 hours after completion of treatment. F Flow cytometric analysis of CCR7 + MHCII+ dendritic cells in the SLN post-treatment with and without MMP9 inhibition. Quantification of normalized percentages relative to control (n = 5 mice per group, p < 0.0001). Data are presented as mean values ± SEM; p values calculated by two-sided unpaired Student’s t test. G Tumor growth curves for tdRT→αPD-1 with and without MMP9 inhibition (n = 10 mice per group, p < 0.0001). Data are presented as mean values ± SEM. Best-fit lines and p values calculated by simple linear regression (two-sided). H TCR analysis showing productive frequency in the sentinel lymph node and tumor for tdRT→αPD-1 (Morisita Index: 0.042, Prod Clonality (norm): 14.9) and SLN LCA + tdRT→αPD-1 (Morisita Index: 0.022, Prod Clonality (norm): 0.45) groups. I TCR clonal analysis showing enriched CDR3 sequences in the sentinel lymph node and tumor for tdRT→αPD-1 and SLN LCA + tdRT→αPD-1 groups. Enriched CDR3 sequences were identified through TCR sequencing and analyzed for clonal distribution. Created in BioRender. Saddawi-Konefka, R. (2025) https://BioRender.com/m675tdd. Source data are provided as a Source Data file.

References

    1. Mody, M. D., Rocco, J. W., Yom, S. S., Haddad, R. I. & Saba, N. F. Head and neck cancer. Lancet398, 2289–2299 (2021). - PubMed
    1. Siegel, R. L., Giaquinto, A. N. & Jemal, A. Cancer statistics, 2024. CA Cancer J. Clin.74, 12–49 (2024). - PubMed
    1. Saddawi-Konefka, R. et al. Defining the role of immunotherapy in the curative treatment of locoregionally advanced head and neck cancer: promises, challenges, and opportunities. Front. Oncol.11, 738626 (2021). - PMC - PubMed
    1. Lee, N. Y. et al. Avelumab plus standard-of-care chemoradiotherapy versus chemoradiotherapy alone in patients with locally advanced squamous cell carcinoma of the head and neck: a randomised, double-blind, placebo-controlled, multicentre, phase 3 trial. Lancet Oncol.22, 450–462 (2021). - PubMed
    1. Machiels, J. P. et al. Pembrolizumab plus concurrent chemoradiotherapy versus placebo plus concurrent chemoradiotherapy in patients with locally advanced squamous cell carcinoma of the head and neck (KEYNOTE-412): a randomised, double-blind, phase 3 trial. Lancet Oncol.25, 572–587 (2024). - PubMed

MeSH terms