. 2025 Jul 17;11(1):67.
doi: 10.1038/s41514-025-00255-8.

Modifiable traits and genetic associations with grey matter volume in mid-to-late adulthood: a population-based study in the UK biobank

Affiliations

Modifiable traits and genetic associations with grey matter volume in mid-to-late adulthood: a population-based study in the UK biobank

Guoqing Pan et al. NPJ Aging. .

Abstract

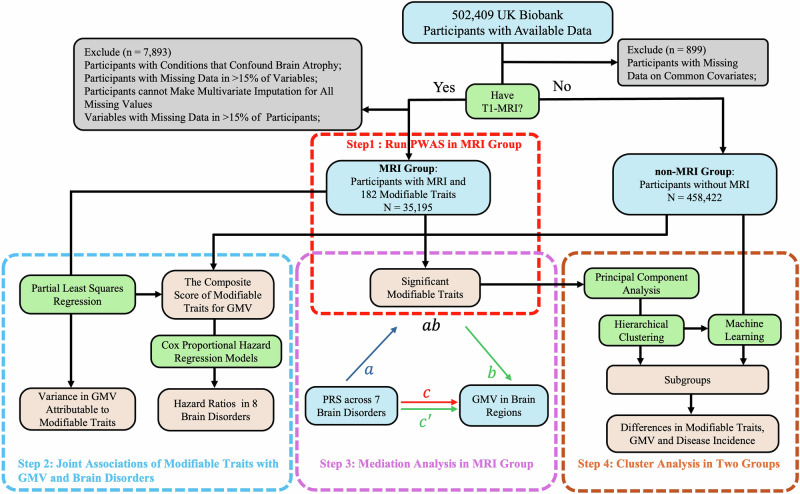
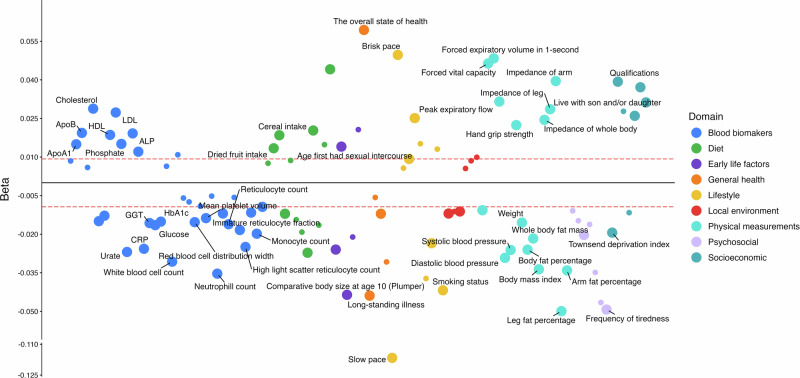
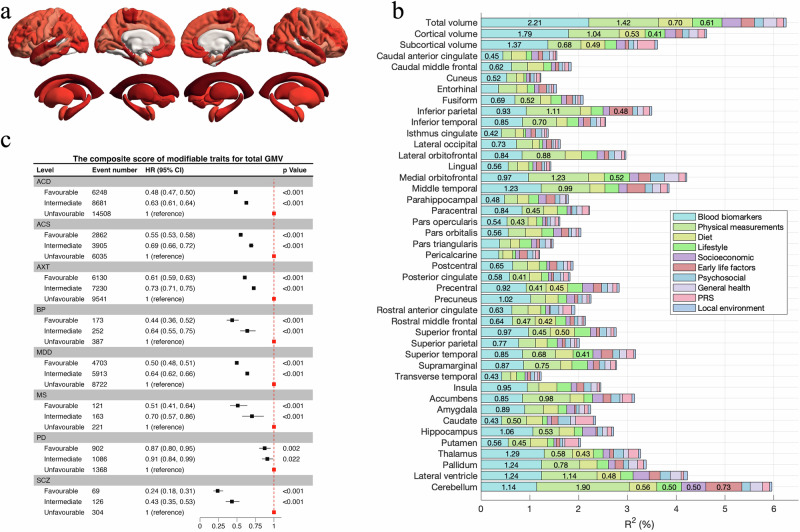
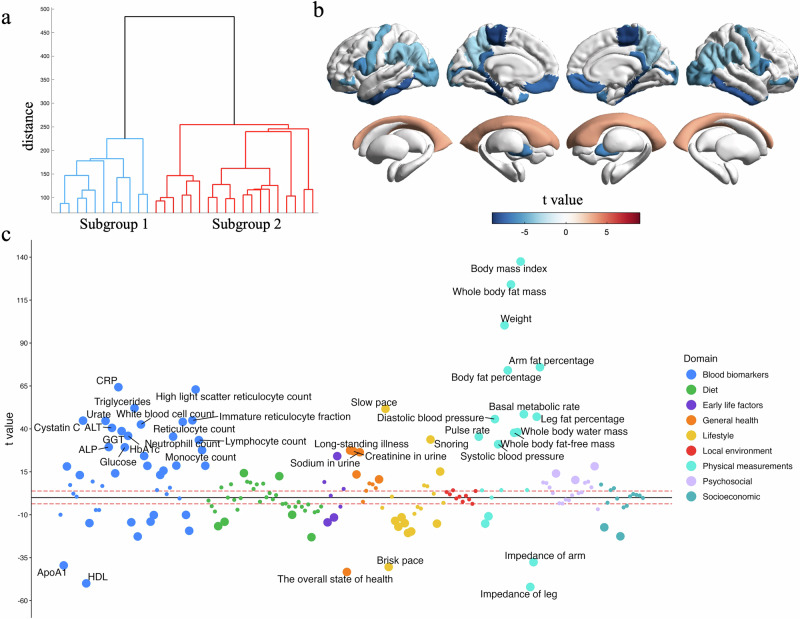
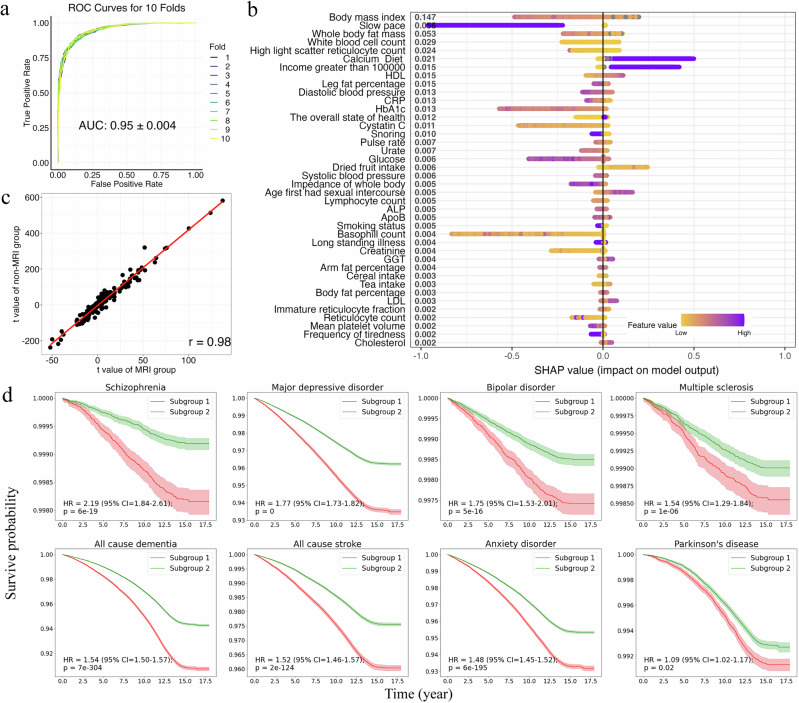
Given the growing global elderly population and the accelerating decrease in grey matter volume (GMV) with age, understanding healthy brain aging is increasingly important. This study investigates whether variations in modifiable traits can account for differences in GMV and whether these traits can inform strategies to mitigate risks of future brain disorders. We identified 66 traits significantly associated with total GMV. Further, we examined the joint contributions of different domain traits to the GMV variance, finding that blood biomarkers and physical measurements accounted for the largest proportion of GMV variance. Some traits mediated the relationship between the genetic risk for brain disorders and GMV. Moreover, the identified traits divided the population into two subgroups, with significant differences in GMV and incidences of brain disorders. Our findings underscore the importance of modifiable traits in supporting healthy brain aging and reducing the risk of brain disorders, suggesting potential targets for intervention.


Conflict of interest statement

Competing interests: The authors declare no competing interests.

Figures

Fig. 1
Fig. 1. Overview of analytic design.
Analytical procedure to identify modifiable traits associated with GMV in the UK Biobank. The study comprises four parts: PWAS of total and regional GMVs, joint association of modifiable traits with GMVs and brain disorders, mediation analysis of the roles of modifiable traits in the relationship between PRS for brain disorders and GMVs, and clustering analysis of identified modifiable traits. The four dotted boxes represent the following analytical stages: PWAS (red), joint association analysis (blue), mediation analysis (pink), and cluster analysis (brown). Solid blue rectangles indicate analyzed data, green signifies analysis methods, and yellow denotes study outcomes.
Fig. 2
Fig. 2. Associations between modifiable traits and total GMV.
The x axis shows the category domains, and the y axis represents regression coefficient. The dashed horizontal line marks the minimum absolute coefficient for factors that are statistically significant after multiple comparisons (Bonferroni correction, P < 2.75 × 10−4). A set of top risk traits was annotated. Models were adjusted for age at baseline, sex, ethnicity, assessment site, imaging center, TIV, and the time interval between baseline assessment and imaging visit.
Fig. 3
Fig. 3. Heat map regarding the association between modifiable traits and regional GMVs.
Models were adjusted for age at baseline, sex, ethnicity, assessment site, imaging center, TIV, and the time interval between baseline assessment and imaging visit. The color of cells indicates the regression coefficient (β) between each modifiable trait and regional GMV (n = 35,195). P values were corrected using Bonferroni correction for multiple tests (* P < 2.75×10⁻⁴; ** P < 1.51×10⁻⁶; *** P < 8.29×10⁻⁹).
Fig. 4
Fig. 4. Modifiable traits joint associations with GMVs and risk of brain disorders.
a The joint explanation of variance with all 182 traits in regional GMV. The detailed results are available in Supplementary Table 2. b The joint explanation of variance in total and regional GMV by different domain modifiable traits. R2 was calculated using PLS after adjusting for age at baseline, sex, ethnicity, assessment site, imaging center, TIV, and the time interval between baseline assessment and imaging visit. The detailed results are available in Supplementary Table 2. c Associations between the composite score of modifiable traits with brain disorders. The unfavorable profile was set as reference in each brain disorder. Dots represent HR horizontal lines indicate corresponding 95% CIs. The detailed results are available in Supplementary Table 4.
Fig. 5
Fig. 5. The hierarchical clustering results and their differences in GMVs and modifiable traits.
a Dendrogram of the hierarchical cluster of patients in MRI group. b The differences in regional GMVs between two subgroups in MRI group. Only ROI with statistically significant corrected P values were visualized in the figures. The full results are available in Supplementary Table 8. c The differences in modifiable traits between subgroups in MRI group. The x axis shows the category domains, and the y axis represents t value of two samples t-test. The dashed horizontal line marks the minimum absolute t value for traits that are statistically significant after multiple comparisons (Bonferroni correction, P < 2.75 × 10−4). A set of top significant traits were annotated. The detailed results are available in Supplementary Table 7.
Fig. 6
Fig. 6. Identified modifiable traits define two subgroups of the population and Kaplan-Meier survival curves between two subgroups.
a Receiver operating characteristic curves showing performance of light-GBM algorithm in a 10-fold cross-validated in MRI group. b The ranked feature importance of the Light-GBM algorithm was determined through SHAP additive explanations for the top 40 predictive features within the model. c Correlation of the t value of modifiable traits in two subgroups between MRI group and non-MRI group. d Kaplan-Meier survival curves between two subgroups across all 8 brain disorders analyzed. The HR, 95% CI, and corresponding p-values for were calculated in Cox proportional hazard regression models. The detailed results are available in Supplementary Table 13.

Similar articles

References

    1. Livingston, G. et al. Dementia prevention, intervention, and care: 2020 report of the Lancet Commission. Lancet396, 413–446 (2020). - PMC - PubMed
    1. Partridge, L., Deelen, J. & Slagboom, P. E. Facing up to the global challenges of ageing. Nature561, 45–56 (2018). - PubMed
    1. Yang, Y., Wang, D., Hou, W. & Li, H. Cognitive Decline Associated with Aging. Adv. Exp. Med. Biol.1419, 25–46 (2023). - PubMed
    1. Bethlehem, R. A. I. et al. Brain charts for the human lifespan. Nature604, 525–533 (2022). - PMC - PubMed
    1. Johansson, M. E., Toni, I., Kessels, R. P. C., Bloem, B. R. & Helmich, R. C. Clinical severity in Parkinson’s disease is determined by decline in cortical compensation. Brain147, 871–886 (2024). - PMC - PubMed

LinkOut - more resources