. 2025 Jul 17;16(1):6597.
doi: 10.1038/s41467-025-61925-5.

Evolving infectious disease dynamics shape school-based intervention effectiveness

Affiliations

Evolving infectious disease dynamics shape school-based intervention effectiveness

Javier Perez-Saez et al. Nat Commun. .

Abstract

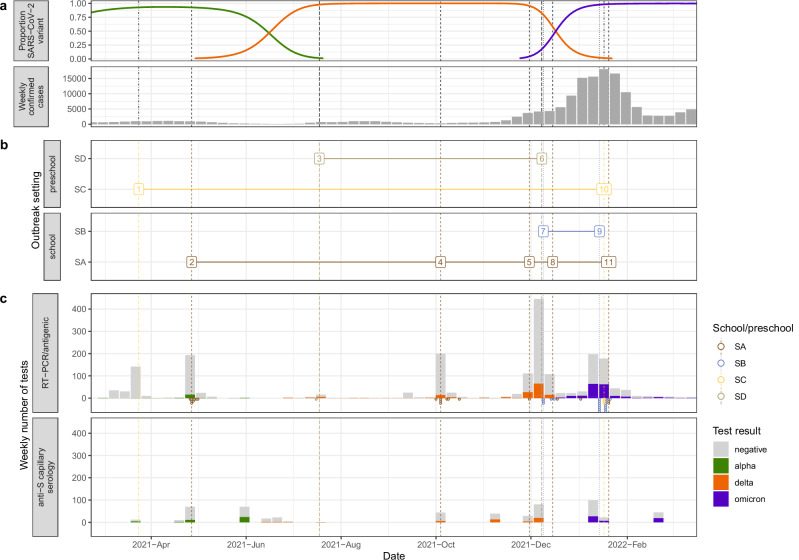
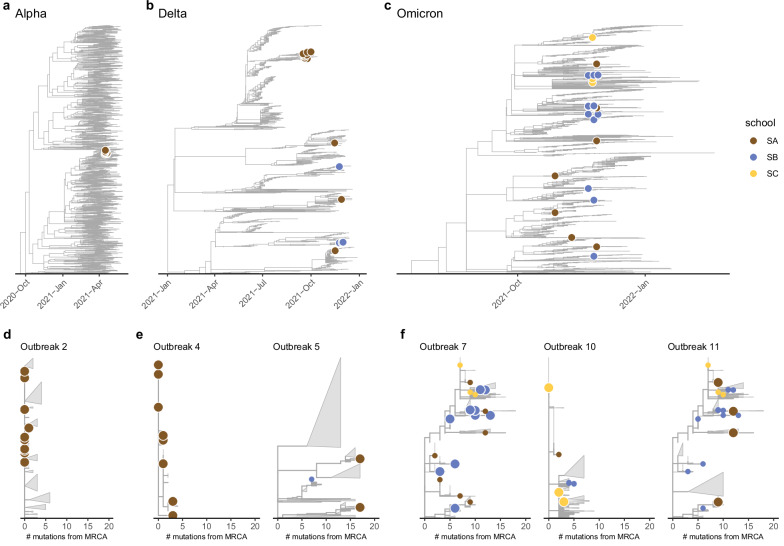
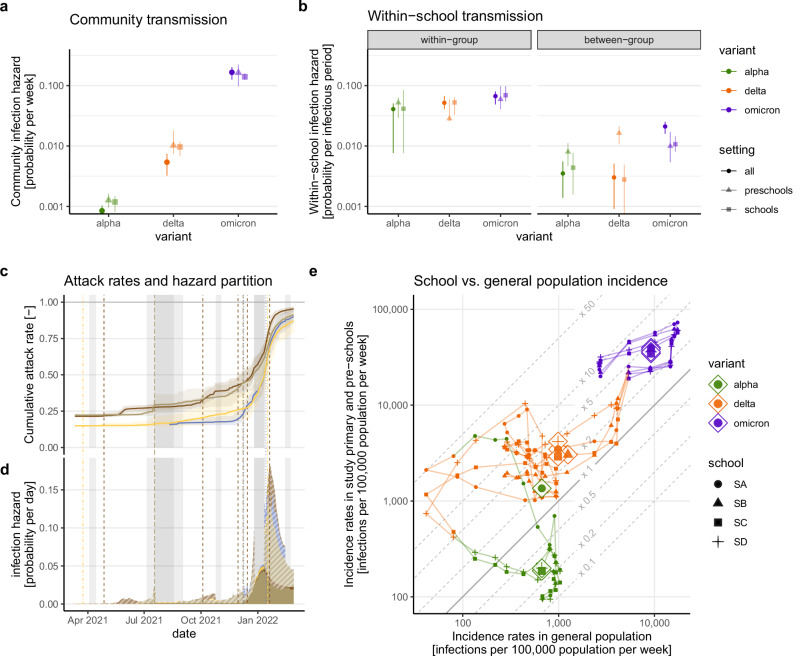
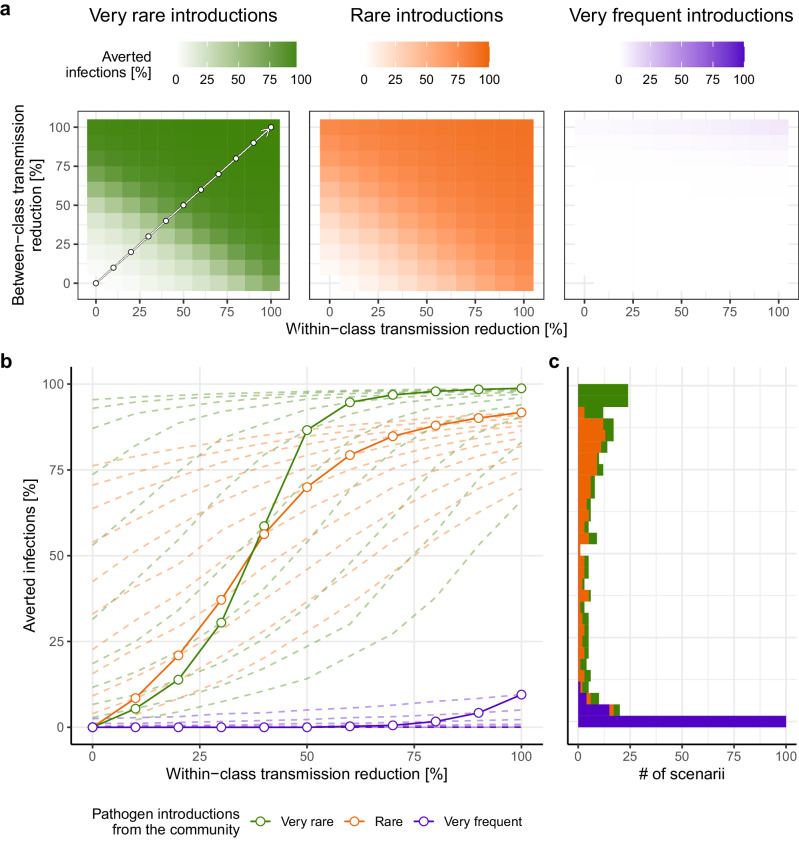
School-based interventions during epidemics are often controversial, as experienced during the COVID-19 pandemic, where reducing transmission had to be weighed against the adverse effects on young children. However, it remains unclear how the broader epidemiologic context influences the effectiveness of these interventions and when they should be implemented. Through integrated modeling of epidemiological and genetic data from a longitudinal school-based surveillance study of SARS-CoV-2 in 2021-2022 (N children = 336, N adults = 51) and scenario simulations, we show how transmission dynamics in schools changed markedly due to strong increases in community-acquired infections in successive periods of viral variants, ultimately undermining the potential impact of school-based interventions in reducing infection rates in the school-aged population. With pandemic preparedness in mind, this study advocates for a dynamic perspective on the role and importance of schools in infectious disease control, one that adapts to the evolving epidemiological landscape shaped by pathogen characteristics and evolution, shifting public health policies, and changes in human behavior.


Conflict of interest statement

Competing interests: The authors declare no competing interests.

Figures

Fig. 1
Fig. 1. Context and outcomes of the SEROCoV-Schools study.
a Study context in the state of Geneva (Switzerland) in terms of the proportion of main SARS-CoV-2 VOCs (top row) and the weekly number of reported positive SARS-CoV-2 cases (bottom row). b Study baseline/endline and SARS-CoV-2 outbreak detection dates (vertical lines indicate dates of first study visit) among the four prospected settings (two schools and two pre-schools), numbers represent the outbreak number. c Weekly number of RADT/RT-PCR tests and serologies from the study population. Serologies were all collected within the study protocol at baseline, endline and during outbreaks at Day 0–2 and Day 30 (Methods). RADT/RT-PCR tests were either collected at baseline, during outbreak investigations (at Day 0–2 and Day 5–7), or tests taken by study participants outside of the study and either reported to our team through questionnaires or notified to Geneva’s Directorate of Health centralized SARS-CoV-2 test result repository. The number of SARS-CoV-2 sequences analyzed are indicated by vertical stacked dots by date of collection.
Fig. 2
Fig. 2. Phylogenetic trees of study sequences identified among local, national and international sequences.
ac Study participant sequences (dots, color indicates study school, no sequences available from school SD) shown within the inferred time-scaled phylogenetic trees including contextual sequences from Geneva, the rest of Switzerland and internationally (Methods), cut to the most recent common ancestor (MRCA) of the three dominant SARS-CoV-2 VOCs circulating in Geneva during the study period for the Alpha (a), Delta (b) and Omicron BA.1 (c) periods (Fig. 1a). Mutation-scaled trees by outbreak in terms of number of mutations from the MRCA of study sequences (large dots indicate study sequences in outbreak, small dots study sequences in other schools), grouped by dominant SARS-CoV-2 variant: Alpha (d, Outbreak #2), Delta (e, Outbreaks #4 and 5), and Omicron BA.1 (f, Outbreaks 7, 10 and 11). Clades that do not contain study sequences were masked as gray triangles.
Fig. 3
Fig. 3. Mathematical modeling inference of changes in school-based SARS-CoV-2 transmission dynamics with changes in dominant VOCs.
a Estimated parameters of the probability of infection per week for community transmission (dots give the maximum likelihood estimate, error bars the 95% Monte Carlo profile CIs), with overall estimates and stratifying by educational setting (primary schools vs. pre-schools, colors), b Same as (a) for within-school transmission parameters, differentiating within-class and between-class transmission in terms of the infection probability per single infectious period. c Inferred cumulative SARS-CoV-2 attack rate in children, (lines give the mean value across trajectories of 500 smoothing distribution draws and children, shaded areas give the 95% quantile interval). d Inferred mean total daily infection hazard by school and its partition between community-acquired transmission (full areas with dark colors), and within-school transmission (light color, hashed areas). Colors indicate schools following Fig. 1. e Comparison of within-school and general population SARS-CoV-2 incidence rates. Lines show school trajectories in time, small dots indicate weeks by dominant VOC period (point types). Large circle dots indicate trajectory centroids (mean over the period of school and general population incidence) by variant and primary or pre-school. General population incidence rates were computed based on reported positive cases corrected for infection under-reporting.
Fig. 4
Fig. 4. Scenario modeling simulations of schools-based NPI effectiveness under different epidemiological contexts and intervention levels.
Proportion of infections averted in school population in terms of the reduction in final attack rates (median of 1000 simulations) as a function of within- and between-class transmission reduction across varying epidemiological contexts ranging from very rare pathogen introductions from the community representing the Alpha SARS-CoV-2 period as inferred in this study (~0.1% probability per person per week, green, a), to rare introductions (Delta-like setting ~1% probability per person per week, orange), and very frequent introductions (Omicron-like setting, ~ 15% probability per person per week, purple). The arrow in the first subpanel represents parameter combinations illustrated by full lines in (b) (diagonal line, equal within-and between-class reductions). b Proportion of infections averted in schools as a function of increasing within-class and between-class transmission reduction (full lines and dots), or across constant levels of between-class transmission reduction (dotted lines). c Histogram of infection reduction across scenarii by epidemiological context.

Similar articles

References

    1. Cauchemez, S. et al. Role of social networks in shaping disease transmission during a community outbreak of 2009 H1N1 pandemic influenza. Proc. Natl. Acad. Sci. USA108, 2825–2830 (2011). - PMC - PubMed
    1. Cauchemez, S., Valleron, A.-J., Boëlle, P.-Y., Flahault, A. & Ferguson, N. M. Estimating the impact of school closure on influenza transmission from Sentinel data. Nature452, 750–754 (2008). - PubMed
    1. Lessler, J. et al. Household COVID-19 risk and in-person schooling. Science372, 1092–1097 (2021). - PMC - PubMed
    1. Conto, C. A. et al. COVID-19: Effects of School Closures on Foundational Skills and Promising Practices for Monitoring and Mitigating Learning Loss. (UNICEF Office of Research-Innocenti, 2020).
    1. Van Lancker, W. & Parolin, Z. COVID-19, school closures, and child poverty: a social crisis in the making. Lancet Public Health5, e243–e244 (2020). - PMC - PubMed

MeSH terms