

Integrating bulk and single cell sequencing data to identify prognostic biomarkers and drug candidates in HBV associated hepatocellular carcinoma
- PMID: 40676059
- PMCID: PMC12271374
- DOI: 10.1038/s41598-025-10876-4
Integrating bulk and single cell sequencing data to identify prognostic biomarkers and drug candidates in HBV associated hepatocellular carcinoma
Abstract
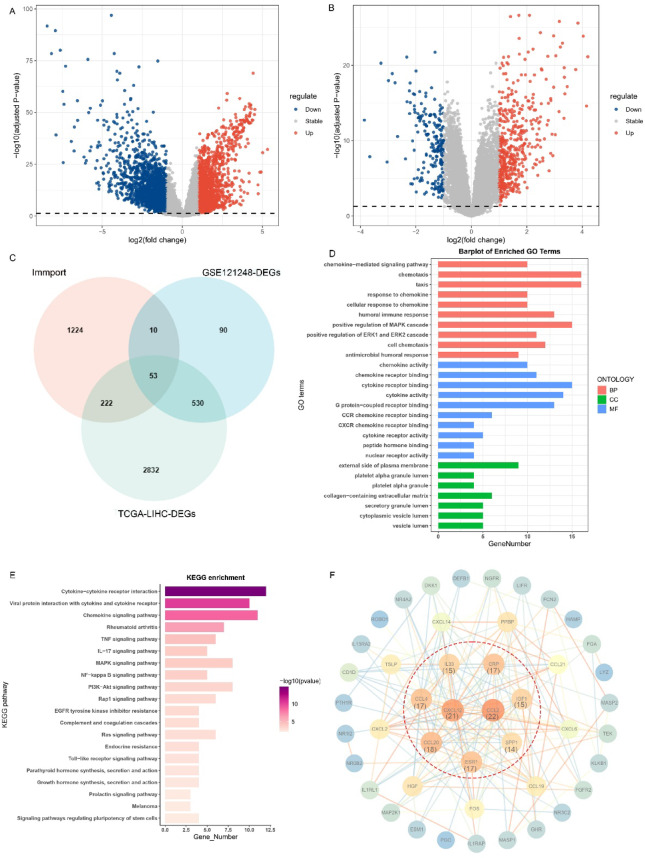
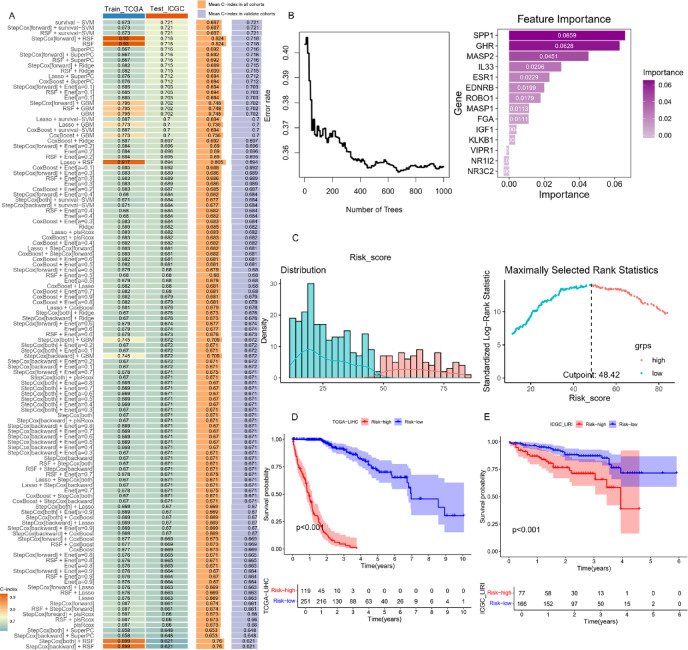
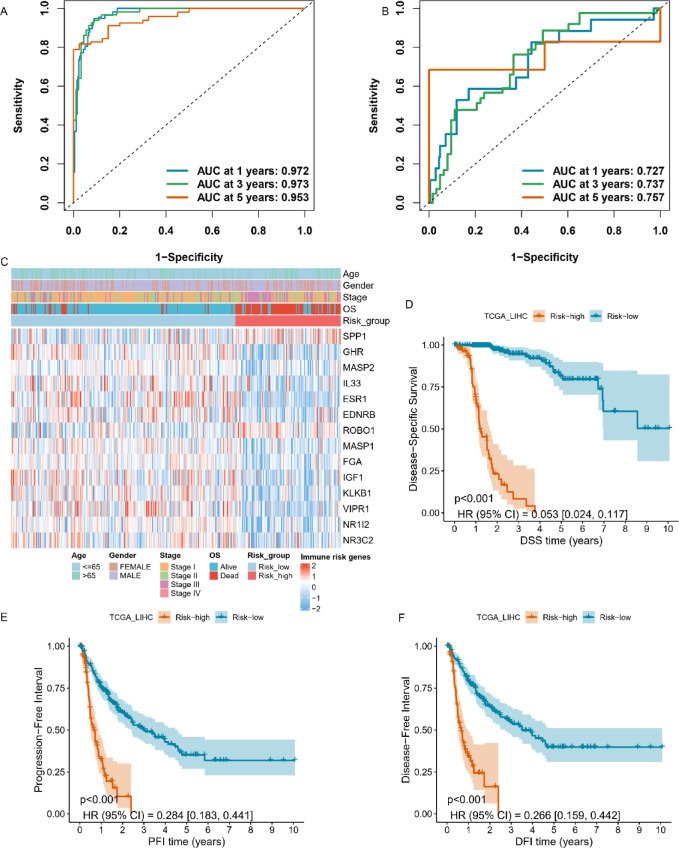
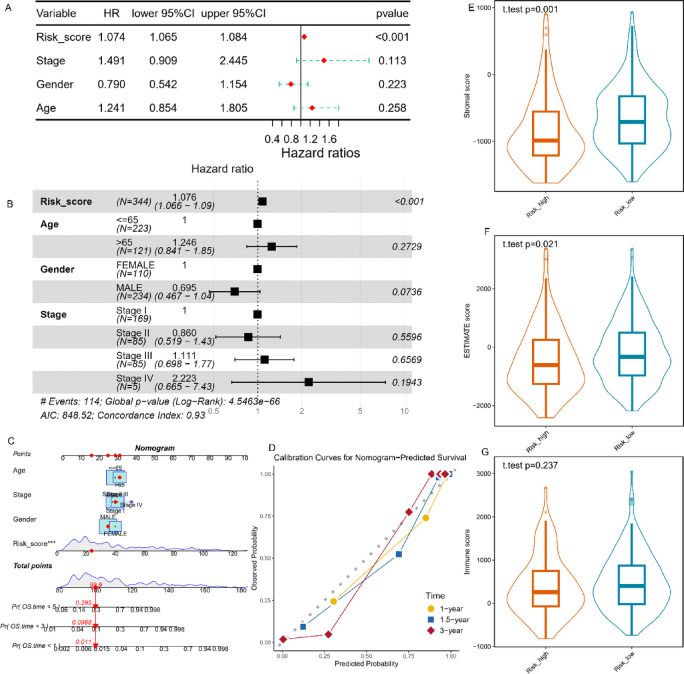
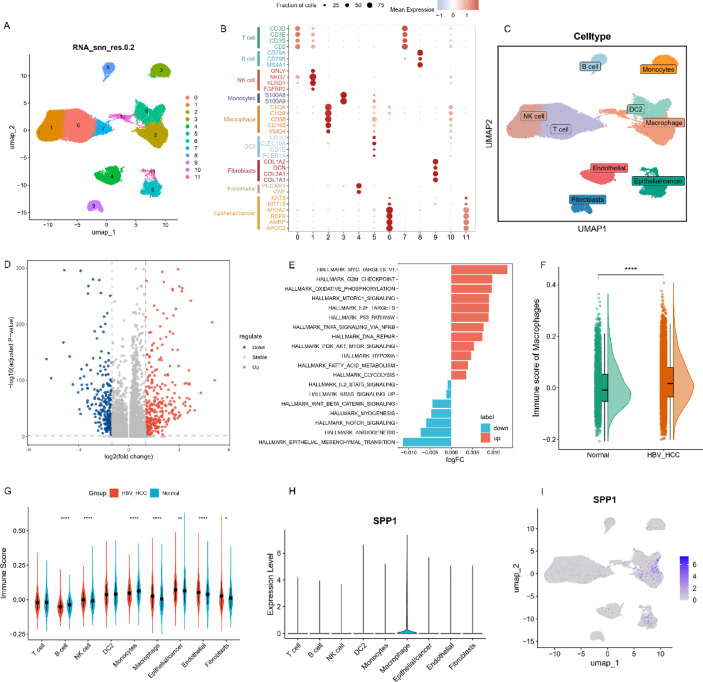
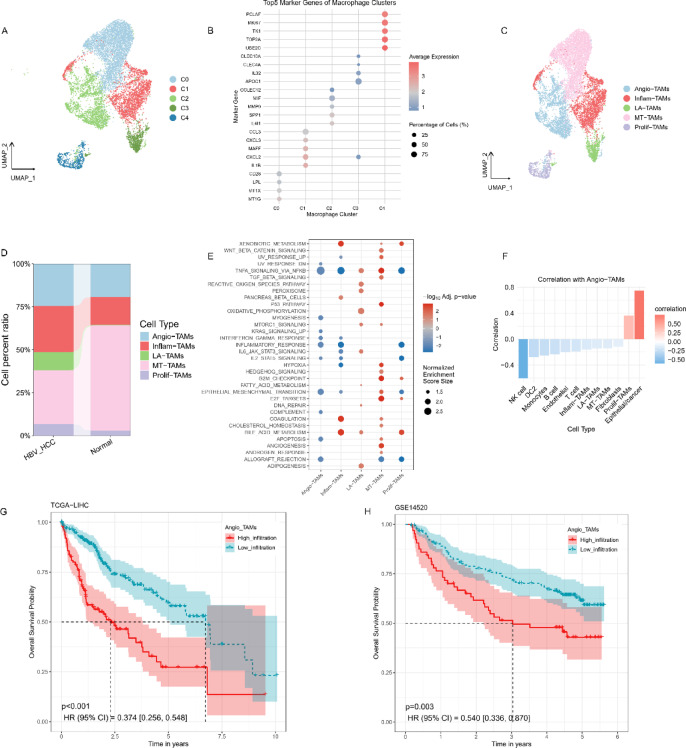
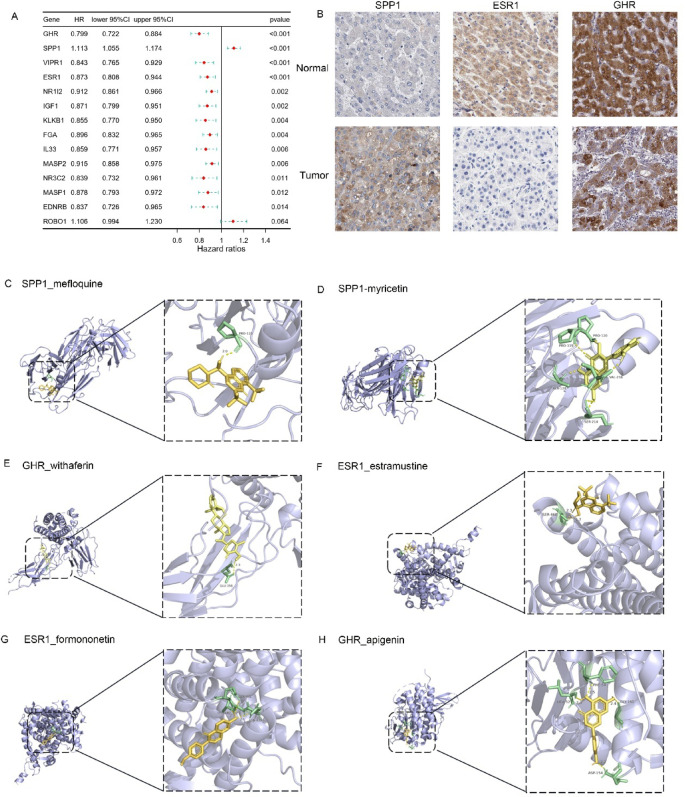
Hepatitis B virus (HBV) infection is a major driver of hepatocellular carcinoma (HCC), yet the mechanisms by which HBV triggers HCC and how it interacts with the immune system remain largely undefined. In this study, 53 immune-related key genes involved in HBV-associated HCC progression were identified. By analyzing the mean C-index of 101 machine learning models, the optimal model-combining stepwise Cox regression (forward) with RSF-was developed to characterize the immune risk index. Patients in the high-risk group exhibited worse survival outcomes and increased infiltration of immunosuppressive cells. Integrating PPI analysis with machine learning, SPP1, GHR, and ESR1 emerged as promising druggable targets, with SPP1 notably overexpressed in tumors and linked to adverse outcomes. ScRNA-seq analysis revealed SPP1 was predominantly expressed in angio-TAMs, which may impair anti-tumor immunity by limiting T and NK cell infiltration. It also involved in tumor progression via angiogenesis and EMT pathways. Drug prediction and molecular docking identified small molecules such as myricetin and mefloquine that can target the aforementioned key immune genes, thereby modulating the immune landscape of HBV-HCC. Repurposing these established drugs represents a novel therapeutic avenue, offering both efficacy and expedited clinical translation for HBV-HCC.
Keywords: HBV associated hepatocellular carcinoma; Immunosuppressive microenvironment; Machine learning; Multi-target Docking; Single-cell RNA sequencing.
© 2025. The Author(s).
Conflict of interest statement
Declarations. Competing interests : The authors declare no competing interests. Ethics approval and consent to participate: The data utilized in this study is exclusively obtained from publicly available sources, eliminating the need for ethical scrutiny.
Figures


Similar articles
-
Multi-omics analysis identifies SNP-associated immune-related signatures by integrating Mendelian randomization and machine learning in hepatocellular carcinoma.Sci Rep. 2025 Jul 4;15(1):23930. doi: 10.1038/s41598-025-09010-1. Sci Rep. 2025. PMID: 40615535 Free PMC article.
-
Viral-Track integrated single-cell RNA-sequencing reveals HBV lymphotropism and immunosuppressive microenvironment in HBV-associated hepatocellular carcinoma.Commun Biol. 2025 Jul 9;8(1):1030. doi: 10.1038/s42003-025-08443-8. Commun Biol. 2025. PMID: 40634523 Free PMC article.
-
Machine learning-assisted multi-dimensional transcriptomic analysis of cytoskeleton-related molecules and their relationship with prognosis in hepatocellular carcinoma.Sci Rep. 2025 Jul 3;15(1):23832. doi: 10.1038/s41598-025-10056-4. Sci Rep. 2025. PMID: 40610613 Free PMC article.
-
Sequencing of systemic therapy in unresectable hepatocellular carcinoma: A systematic review and Bayesian network meta-analysis of randomized clinical trials.Crit Rev Oncol Hematol. 2024 Dec;204:104522. doi: 10.1016/j.critrevonc.2024.104522. Epub 2024 Sep 26. Crit Rev Oncol Hematol. 2024. PMID: 39332750
-
Applications of next-generation sequencing analysis for the detection of hepatocellular carcinoma-associated hepatitis B virus mutations.J Biomed Sci. 2018 Jun 2;25(1):51. doi: 10.1186/s12929-018-0442-4. J Biomed Sci. 2018. PMID: 29859540 Free PMC article.
References
-
- Liu, Y. et al. Identification of a tumour immune barrier in the HCC microenvironment that determines the efficacy of immunotherapy. J. Hepatol.78, 770–782. 10.1016/j.jhep.2023.01.011 (2023). - PubMed
-
- Kudo, M. et al. Lenvatinib versus Sorafenib in first-line treatment of patients with unresectable hepatocellular carcinoma: a randomised phase 3 non-inferiority trial. Lancet (London England). 391, 1163–1173. 10.1016/s0140-6736(18)30207-1 (2018). - PubMed
-
- Finn, R. S. et al. Atezolizumab plus bevacizumab in unresectable hepatocellular carcinoma. N. Engl. J. Med.382, 1894–1905. 10.1056/NEJMoa1915745 (2020). - PubMed
-
- Lim, C. J. et al. Multidimensional analyses reveal distinct immune microenvironment in hepatitis B virus-related hepatocellular carcinoma. Gut68, 916–927. 10.1136/gutjnl-2018-316510 (2019). - PubMed
MeSH terms
Substances
Grants and funding
- 62472069/National Natural Science Foundation of China
- 2021HXFH001/1.3.5 project for disciplines of excellence-Clinical Research Incubation Project, West China Hospital, Sichuan University
- ZYAI24030/1.3.5 project for Artificial Intelligence West China Hospital, Sichuan University
- 312230752/China Telecom Sichuan Company Biliary Tract Tumor Big Data Platform and Application Phase I R&D Project
- 82203650/National Natural Science Foundation of China for Young Scientists Fund
- 2024NSFSC0742/Sichuan Natural Science Foundation
- 2024YFFK0384/Sichuan Science and Technology Program
- 24QNMP031/Science and Technology project of the Health planning committee of Sichuan
- 2022CDSN-18/Sichuan University-Sui Ning School-local Cooperation project
- 2024HXBH134/the Postdoctor Research Fund of West China Hospital, Sichuan University
- XH2023-032/(Qilu) Clinical Research of Sichuan Anticancer Association
LinkOut - more resources
Full Text Sources
Medical
Research Materials
Miscellaneous
