. 2025 Jul 17;8(1):1060.
doi: 10.1038/s42003-025-08480-3.

Affective information modulates slow-wave- and arousal-like responses during NREM sleep

Affiliations

Affective information modulates slow-wave- and arousal-like responses during NREM sleep

Demetrio Grollero et al. Commun Biol. .

Abstract

Sleep is characterized by relative disconnection from the external environment and prompt reversibility in response to salient stimuli. During non-rapid eye movement (NREM) sleep, reactive electroencephalographic (EEG) slow waves (K-complexes, KC) are thought to both suppress the processing of external stimuli and open 'sentinel' windows during which further relevant inputs may be tracked. However, the extent to which a stimulus's relevance modulates the KC-related response remains unclear. Here, we investigated the impact of emotional information in human vocal bursts on KC and post-KC activity. Twenty-five young adults were presented with vocal bursts conveying negative, neutral, and positive emotions. We found that affective content influenced the rate, amplitude, and cortical distribution of KCs, as well as post-KC high-frequency activity. These results indicate that KCs are not all-or-none responses and that salient information is not entirely 'quenched' by KCs. These insights offer new perspectives on how sleep continuity and reversibility are regulated.


Conflict of interest statement

Competing interests: The authors declare no competing interests.

Figures

Fig. 1
Fig. 1. Experimental procedures.
a Each dot represents a stimulus from the original full pool (n = 1008 stimuli) plotted with respect to its z-scored valence (x-axis) and arousal (y-axis). Colored dots represent the selected stimuli for negative (blue), neutral (yellow), and positive (red) valence. b Experimental paradigm. Each participant completed an overnight EEG session and a wakefulness session, the latter including an EEG recording during stimulus presentation and an affective rating task. Vocal burst stimuli were presented in random order during NREM sleep and wakefulness experimental sessions. The photo used in this figure was reproduced and modified with permission from the author, Agnese Morganti.
Fig. 2
Fig. 2. Stimulus-dependent brain activity changes during wakefulness.
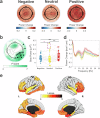
a The Global Field Potential (GFP) responses are shown as average ± standard error of the mean (SEM), with different colors for negative (blue), neutral (yellow), and positive (red) valence stimuli. Time 0 corresponds to stimulus onset. The dark bars at the bottom of the plot indicate uncorrected effects with p < 0.05 (rmANOVA). The gray shaded area corresponds to significant effects surviving after correction for multiple comparisons (p < 0.05, corrected). b Topographic distribution of mean EEG voltages across significant timepoints. c Post-hoc comparisons based on mean GFP values across significant timepoints, each dot represents a distinct participant (n = 25). *p < 0.05, **p < 0.01, ***p < 0.001. Box-plots whiskers represent ± 1.5 IQR from Q1/Q3.
Fig. 3
Fig. 3. Evoked KCs.
a From left to right, the panel shows the ERPs computed from all stimuli, the ERPs computed only from stimuli followed by a KC, and the ERPs computed only from stimuli that did not lead to a KC. The green shaded area marks the time between stimulus onset and offset, while the gray shaded area marks the window used for baseline correction. The ERPs are shown as average ± standard error of the mean (SEM), with different colors for negative (blue), neutral (yellow), and positive (red) valence stimuli. For display purposes, the plotted signals were detrended using robust detrend and low-pass filtered at 45 Hz. b The boxplots show the ratio between evoked KCs and administered stimuli for each valence class. c The boxplots show the mean peak-to-peak amplitude of evoked KCs for each valence class. In b and c, each dot represents a distinct participant (n = 25). *p < 0.05, **p < 0.01, ***p < 0.001. Box-plots whiskers represent ± 1.5 IQR from Q1/Q3.
Fig. 4
Fig. 4. Effect of spontaneous slow waves on evoked KCs.
a The boxplots show the percentage of spontaneous slow waves detected around the onset of stimulus presentation with respect to the total number of trials with evoked KCs (KC+) or no detected KCs (KC−). b The boxplots show the mean amplitude of spontaneous slow waves detected around the onset of stimulus presentation for trials with evoked KCs or no detected KCs. c Difference in topographic scalp involvement of slow waves detected around stimulus onset between trials with evoked KCs (orange) and no detected KCs (purple). Black dots mark significant effects (p < 0.05, cluster-mass correction). In a, b, each dot represents a distinct participant (n = 25). *p < 0.05, **p < 0.01, ***p < 0.001. Box-plots whiskers represent ± 1.5 IQR from Q1/Q3.
Fig. 5
Fig. 5. Results of the topographic analyses for distinct components of the KC.
a From left to right, the panel shows the results of the rmANOVA for P200, N550, and P900 components. Black dots mark electrodes showing a significant effect with p < 0.05, cluster-mass correction. b From left to right, the panel shows the post-hoc comparisons for P200, N550, and P900 components. Each dot represents the average value across significant electrodes shown in a for each participant (n = 25). P200 values were obtained computing the average across all electrodes as no significant effects were observed in the topographic analysis. *p < 0.05, **p < 0.01, ***p < 0.001. Box-plots whiskers represent ± 1.5 IQR from Q1/Q3.
Fig. 6
Fig. 6. Source modeling analysis of the N550 and P900 KC components.
a Significant differences in the N550 KC component between negative and neutral stimuli (t-score; q < 0.05, FDR correction). b Significant differences in the P900 KC component between negative and neutral stimuli (left), and between positive and neutral stimuli (right). Medial structures depicted in black were not modeled and tested.
Fig. 7
Fig. 7. Time-frequency analysis.
Brain activity changes associated with the occurrence of KCs were assessed using a time-frequency analysis time-locked to the KC negative peak. The plots in the top panels refer to a frontal electrode (F3), while the bottom panels refer to a centro-parietal electrode (CP4). a Time-frequency signal decomposition for negative, neutral, and positive stimuli. The mean KC response (scaled to the right y-axis) is superimposed on the time-frequency results to better illustrate the relationship between the KC phase and power changes. b Significant differences for the contrasts between negative and neutral stimuli (left), and between positive and neutral stimuli (right) in two representative electrodes. Dark contours mark significant differences at p < 0.05, corrected. For each significant cluster, we calculated the percent power difference relative to the neutral condition (mean ± SEM). F3 electrode: negative vs. neutral, cluster 1 = 17.15 ± 5.44%; positive vs. neutral, cluster 1 = 31.39 ± 7.76%. CP4 electrode: negative vs. neutral, cluster 1 = 40.57 ± 10.06%, cluster 2 = 24.12 ± 7.47%; positive vs. neutral, cluster 1 = 74.71 ± 50.83%, cluster 2 = 46.24 ± 21.95%, cluster 3 = 27.27 ± 7.60%.
Fig. 8
Fig. 8. Changes in signal power after evoked KCs.
a Topographic distribution of relative beta-power changes (18–30 Hz) for the three valence classes. b Results of the topographic rmANOVA for beta power variations across valence classes. Black dots mark electrodes showing a significant effect with p < 0.05, cluster-mass correction. c Post-hoc comparisons between valence classes. Each dot represents average values computed within the cluster of electrodes shown in b for each subject. The purple dashed line marks two outliers in the neutral condition. After removal of these outliers the contrast between negative and neutral stimuli becomes significant (purple *). *p < 0.05, **p < 0.01, ***p < 0.001. d Mean spectral power changes after KCs computed as log(power_post)-log(power_pre) for each valence class (mean across electrodes depicted in b). e Source modeling analysis showing significant beta-power change differences between positive and neutral stimuli (q < 0.05, FDR correction). Medial structures depicted in black were not modeled and tested. Box-plots whiskers represent ± 1.5 IQR from Q1/Q3.

References

    1. Anafi, R. C., Kayser, M. S. & Raizen, D. M. Exploring phylogeny to find the function of sleep. Nat. Rev. Neurosci.20, 2 (2019). Article. - PubMed
    1. Sotelo, M. I., Tyan, J., Dzera, J. & Eban-Rothschild, A. Sleep and motivated behaviors, from physiology to pathology. Curr. Opin Physiology15, 159–166 (2020).
    1. Simon, K. C., Nadel, L. & Payne, J. D. The functions of sleep: a cognitive neuroscience perspective. Proc. Natl. Acad. Sci. USA119, e2201795119 (2022). - PMC - PubMed
    1. Bonnet, M. H. & Arand, D. L. Clinical effects of sleep fragmentation versus sleep deprivation. Sleep. Med. Rev.7, 297–310 (2003). - PubMed
    1. Boon, M. E., van Hooff, M. L. M., Vink, J. M. & Geurts, S. A. E. The effect of fragmented sleep on emotion regulation ability and usage. Cognit. Emot.37, 1132–1143 (2023). - PubMed

LinkOut - more resources