

Multi-omic characterization of early-onset esophagogastric cancer
- PMID: 40676191
- PMCID: PMC12271507
- DOI: 10.1038/s41698-025-01030-4
Multi-omic characterization of early-onset esophagogastric cancer
Abstract
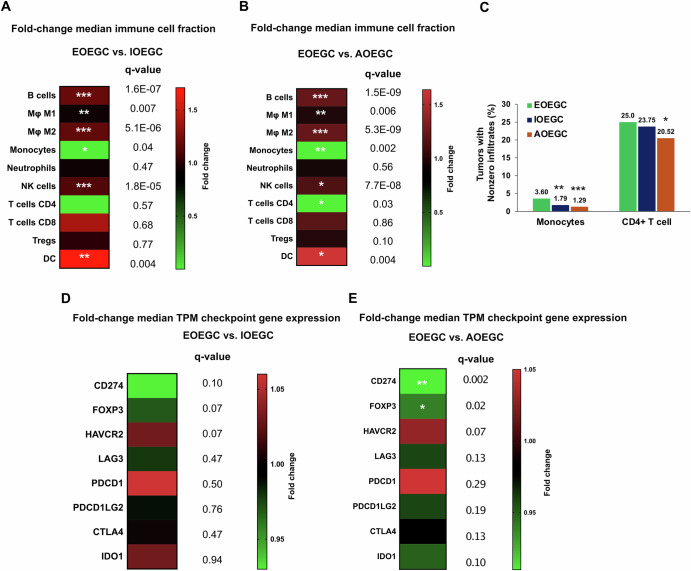
Using a large real-world database with matched genomic and transcriptomic data, we characterized clinical and molecular differences between patients with early-onset esophagogastric cancer (EOEGC; <50 years), intermediate-onset esophagogastric cancer (IOEGC; 50-65 years), and average-onset esophagogastric cancer (AOEGC; >65 years). We analyzed clinicopathologic, whole transcriptome, and DNA-sequencing data from 5175 patient samples (EOEGC, n = 530; IOEGC, n = 1744; AOEGC, n = 2901) from the Caris Life Sciences database. Immune deconvolution was performed with quanTIseq and pathway enrichment with Gene Set Enrichment Analysis (GSEA). Real-world overall survival was estimated from insurance claims data. Prevalence of EOEGC was higher in patients who were Black, Asian, Hispanic/Latino, and female. Patients with EOEGC had higher proportion of CDH1 mutations; FGFR2, CCNE1, MYC copy number alterations; and ARHGAP26 fusions. Patients with EOEGC had decreased prevalence of immune-oncology markers of microsatellite instability-high, tumor mutation burden-high, and PD-L1 positivity. Immune microenvironment analysis identified significant enrichment of M2 macrophages and decreased M1 macrophages in patients with EOEGC. GSEA identified enrichment of epithelial mesenchymal transition and coagulation pathways in patients with EOEGC. This large real-world characterization of age-stratified esophagogastric cancer found that EOEGC was associated with significant racial, ethnic, and gender differences, and notable molecular differences that may have prognostic and therapeutic implications.
© 2025. The Author(s).
Conflict of interest statement
Competing interests: L.W.W., S.J., J.P., and S.G. declare no competing interests. S.K.D., S.W., and J.X. are employees of Caris Life Sciences. V.K.L. has served in a consultant/advisory role for Pfizer, Genentech/Roche, Iovance Biotherapeutics, Anheart Therapeutics, Takeda, Seattle Genetics, Bristol Myers Squibb, AstraZeneca and Guardant Health, and has received research funding from GlaxoSmithKline, Bristol Myers Squibb, AstraZeneca, Merck and Seattle Genetics. R.T.S. has served in a consult/advisory role for AstraZeneca, Boehringer Ingelheim Pharma, Clovis, Genentech, Incyte, Merck, QED Therapeutics, Servier, Taiho, Zymeworks Biopharm, Syros, Astellas, Natera, Hoopika Pharma, Abbvie, Duo Oncology, and has received research funding from Bayer, Bristol Myers Squibb, Exelixis Pharmaceuticals, IMV Inc, LOXO, Novocure, NUCANA, Pieris, Rafael Pharmaceuticals, Seagen. R.H.M. has served in a consult/advisory role for Puretech Health, IDEAYA Biosciences, Nimbus Therapeutics, and Amgen; and has received research funding from Nimbus Therapeutics and Repare Therapeutics.
Figures


References
-
- Bray, F. et al. Global cancer statistics 2018: GLOBOCAN estimates of incidence and mortality worldwide for 36 cancers in 185 countries. CA Cancer J. Clin.68, 394–424 (2018). - PubMed
-
- Ferlay, J. et al. Estimating the global cancer incidence and mortality in 2018: GLOBOCAN sources and methods. Int J. Cancer144, 1941–1953 (2019). - PubMed
-
- Islami, F., DeSantis, C. E. & Jemal, A. Incidence Trends of Esophageal and Gastric Cancer Subtypes by Race, Ethnicity, and Age in the United States, 1997-2014. Clin. Gastroenterol. Hepatol.17, 429–439 (2019). - PubMed
-
- Bergquist, J. R. et al. Early-onset gastric cancer is a distinct disease with worrisome trends and oncogenic features. Surgery166, 547–555 (2019). - PubMed
Grants and funding
LinkOut - more resources
Full Text Sources
Research Materials
Miscellaneous
