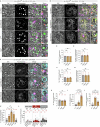
. 2025 Aug;44(16):4443-4472.
doi: 10.1038/s44318-025-00497-y. Epub 2025 Jul 17.

Amyloid-β disrupts APP-regulated protein aggregation and dissociation from recycling endosomal membranes

Affiliations

Amyloid-β disrupts APP-regulated protein aggregation and dissociation from recycling endosomal membranes

Preman J Singh et al. EMBO J. 2025 Aug.

Abstract

Secretory proteins aggregate into non-soluble dense-core granules in recycling endosome-like compartments prior to regulated release. By contrast, aberrantly processed, secreted amyloid-β (Aβ) peptides derived from amyloid precursor protein (APP) form pathological extracellular amyloidogenic aggregations in late-stage Alzheimer's disease (AD). By examining living Drosophila prostate-like secondary cells, we show that both APP and Aβ peptides affect normal biogenesis of dense-core granules. These cells generate dense-core granules and secreted nanovesicles called Rab11-exosomes via evolutionarily conserved mechanisms within highly enlarged secretory compartments with recycling endosomal identity. The fly APP homologue, APP-like (APPL), associates with these vesicles and the compartmental limiting membrane, from where its extracellular domain modulates protein aggregation. Proteolytic release of this domain permits mini-aggregates to coalesce into a large central dense-core granule. Mutant Aβ expression disrupts this process and compartment motility, and increases aberrant lysosomal targeting, mirroring previously unexplained early-stage pathological events in AD. It also promotes cell-to-cell propagation of these endolysosomal defects, again phenocopying changes observed in AD. Our data therefore demonstrate physiological roles for APP in membrane-dependent protein aggregation, involving molecular mechanisms, which when disrupted by Aβ peptides, trigger Alzheimer's disease-relevant pathologies.

Keywords: Alzheimer’s Disease; Dense-Core Granules; Exosomes; Rab11; Transforming Growth Factor-Beta-Induced.


Conflict of interest statement

Disclosure and competing interests statement. The authors declare no competing interests.

Figures

Figure 1
Figure 1. Drosophila MFAS selectively drives DCG assembly in SCs.
(A) Schematic showing male accessory gland, secondary cells (SCs) at the distal tip, and key SC compartments. (B) Ex vivo, wide-field fluorescence micrograph merged with differential interference contrast (DIC) image of SC from a 6-day-old male expressing GFP-mfas gene trap, showing fusion protein concentrated inside DCGs. GFP-mfas does not affect the number of DCGs per SC compared to controls. (C) SCs expressing GFP-mfas gene trap and SC-specific rosy-RNAi or mfas-RNAi. Following mfas knockdown, large compartments lack DCGs, which are normally readily identified by DIC (see Zoom panels for compartments outlined with white boxes), and only sporadic puncta are observed (grey arrowhead). (D) SCs expressing YFP-Rab11 and SC-specific rosy-RNAi or mfas-RNAi. Most compartments contain Rab11-positive ILVs (green arrowhead in Zoom), which often co-localise with puncta detected by DIC. (E) Stills from a time-lapse movie of DCG biogenesis in SC expressing GFP-mfas gene trap, focusing on the compartment marked by the white box (DIC and GFP in top row; GFP in bottom row). td-GFP-mfas = tub-GAL80ts/+; dsx-GAL4, GFP-mfas/+. (FH) Bar charts showing DCG biogenesis (F), numbers of Rab11-positive large compartments (G) and the proportion of these compartments containing Rab11-positive ILVs (H) in mfas knockdown SCs (two independent RNAis) and control. In all images, approximate cell boundary and compartment boundaries are marked with a dashed white line; n nuclei of binucleate cells; LysoTracker Red (magenta) marks acidic compartments in (BD). Scale bars = 5 and 1 µm in Zoom. For bar charts, data are mean ± SEM, analysed using the Kruskal–Wallis test; n number of animals (red, above bar), ***P < 0.001, ns not significant. In (F), P = 0.0005 for both comparisons. See also Fig. EV1; Movies EV1 and EV2. Source data are available online for this figure.
Figure 2
Figure 2. GAPDH2 regulates mini-core fusion in SC DCG biogenesis.
(A) SCs expressing GFP-mfas gene trap and SC-specific rosy-RNAi or GAPDH2-RNAi. Following GAPDH2 knockdown, large secretory compartments contain multiple GFP-MFAS-positive mini-cores (blue arrowhead), visible by DIC (Zoom panels). White asterisks and white boxes marked with asterisks indicate compartments with DCG acidification phenotype (lower Zoom panel; red arrowhead marks acidic domain; not present in the control SC). (B, C) Bar charts plotting the number of DCG compartments (B) and proportion of compartments with multiple mini-cores (C). (D) Stills from a time-lapse movie of DCG biogenesis in SC expressing GFP-mfas gene trap and GAPDH2-RNAi, focusing on an immature DCG compartment (top rows [Box 1]) and a mature compartment (bottom rows [Box 2]). Note mini-cores remain motile within compartments that also rotate within the cell (two mini-cores marked by purple and orange arrowheads [Box 2]). (E) Bar chart plotting the proportion of large SC compartments with the DCG acidification phenotype. In all images, n nuclei; LysoTracker Red (magenta) marks acidic compartments in (A). Scale bars = 5 and 1 µm in Zoom. For bar charts, data are mean ± SEM, analysed using the Mann–Whitney test; n animal number above bar, ****P < 0.0001, ns not significant. See also Movie EV3 and Appendix Table S2. Source data are available online for this figure.
Figure 3
Figure 3. Drosophila APPL regulates the formation of large DCGs in SCs.
(A) Schematic showing structural similarities between human APP and Drosophila APPL proteins, the location of α-, β- and γ-secretase cleavage sites, and the APP cleavage products. (B) SCs expressing GFP-mfas gene trap and SC-specific rosy-RNAi, Appl-RNAi, APP-YFP, and Appl-RNAi and APP-YFP combined. Note multiple mini-cores (blue arrowhead) in Appl knockdown, also visible by DIC (white boxes and upper Zoom panels). White asterisks and white boxes marked with asterisks indicate DCG acidification phenotype (lower Zoom panel; red arrowheads mark acidic microdomains). Partially intact DCG marked with light blue arrowhead. (CE) Bar charts showing effects of Appl knockdown and APP expression on the number of DCG compartments (C), mini-core formation (D) and DCG acidification phenotype (E). (F) Bar chart showing frequency of mini-core overlap over 30 min in time-lapse videos for single mini-cores selected from multiple different compartments, following SC-specific GAPDH2 and Appl knockdown, and expression of human AD-associated Aβ-42-Dutch and Aβ-42 Iowa mutants. (G) Stills from a time-lapse movie of DCG biogenesis in SC from a 6-day-old male expressing GFP-mfas gene trap and Appl-RNAi, focusing on one compartment forming mini-cores (Box 1) and another mature compartment (Box 2). Note compartments and mini-cores are relatively immobile (two mini-cores marked by purple and orange arrowheads [Box 2]). In all images, n nuclei; LysoTracker Red (magenta) marks acidic compartments in (B). Scale bars = 5 and 1 µm in Zoom. For bar charts, data are mean ± SEM analysed using Kruskal–Wallis test; n = animal number above bar, *P < 0.05, ***P < 0.001, ****P < 0.0001, ns not significant. In (E), rosy vs Appl #1, P = 0.0003; rosy vs Appl #2, P = 0.038. In (F), GAPDH2 vs Aβ-Dutch, P = 0.0008. See also Fig. EV2; Appendix Figs. S2 and S3A; Movie EV4. Source data are available online for this figure.
Figure 4
Figure 4. Cleavage of Drosophila APPL accompanies normal DCG formation.
(A) Schematic showing two fluorescently tagged APPL constructs employed. (B, C) SCs from 6-day-old males expressing either double-tagged APPL (dt-APPL; B) or APPL-EGFP (C). For both cells, magnified images in Zoom highlight a DCG precursor compartment (Zoom #1); a mature DCG compartment (in (B), DCG contains APPL’s ECD (green) and limiting membrane carries APPL’s ICD (red)) (Zoom #2); a more mature DCG compartment with no peripheral ICD (Zoom #3) and a compartment that appears to have the DCG acidification phenotype (Zoom #4). White asterisk marks other compartments with the DCG acidification phenotype. ILVs inside (yellow arrowheads) and at the periphery (magenta arrowheads) of DCG compartments are marked. In (B), the white arrowhead marks a very early acidified DCG compartment, and in (C), the black arrowhead (Zoom #4, Merge) marks a DCG that is starting to form inside the DCG precursor compartment, and the red arrowhead marks an acidic microdomain. In all images, n nuclei; LysoTracker Red (magenta) marks acidic compartments in (C). Scale bars = 5 and 1 µm in Zoom. See also Appendix Fig. S3B; Movie EV4. Source data are available online for this figure.
Figure 5
Figure 5. Drosophila APPL regulates DCG protein aggregation, and its cleavage is required for normal DCG formation.
(A) Schematic showing APPL constructs lacking α- and β-secretase cleavage sites (deletion in red near transmembrane domain). APPL-ΔsdE1 construct lacks a large part of the E1 domain. (B) SCs expressing GFP-mfas gene trap and either no other transgene, or SC-specific wild-type APPL (APPL-WT), APPL-Δsd or APPL-ΔsdE1. Note abnormal DCG phenotypes compared to w1118 control (compartments outlined with white boxes, upper Zoom; blue arrowheads mark abnormal DCGs). For APPL-ΔsdE1, the lower panels show individual z-plane images of the highlighted compartment to illustrate the peripheral network with limited centrally located GFP-MFAS aggregation. White asterisks and white boxes marked with asterisks indicate DCG acidification phenotype (lower Zoom; red arrowheads mark acidic microdomains). Enlarged acidic main cell compartments containing GFP are outlined (orange dashed lines). (CF) Bar charts showing DCG compartment number (C), proportion of abnormal DCGs (D), proportion of large compartments with DCG acidification phenotype (E), SC lysosomal area (F), and accumulation of GFP-MFAS in main cells expressed as percentage of total main cell area that contains GFP ((G); see also Fig. EV4). In all images, n nuclei; LysoTracker Red (magenta) marks acidic compartments. Scale bars = 5 and 1 µm in Zoom. For bar charts, data are mean ± SEM, analysed using the Kruskal–Wallis test; n = animal number above bar, *P < 0.05, **P < 0.01, ***P < 0.001, ****P < 0.0001, ns not significant. In (D), w1118 vs Appl-WT, P = 0.034; Appl-WT vs Appl-ΔsdE1, P = 0.015. In (E), w1118 vs Appl-WT, P = 0.009; w1118 vs Appl-ΔsdE1, P = 0.009. In (F), w1118 vs Appl-WT, P = 0.0056; Appl-WT vs Appl-Δsd, P = 0.0001; Appl-WT vs Appl-ΔsdE1, P = 0.0003. See also Figs. EV3 and EV4; Appendix Figs. S4 and S5. Source data are available online for this figure.
Figure 6
Figure 6. Expression of pathological mutant Aβ-42 peptides in SCs disrupts DCG biogenesis and increases lysosomal targeting.
(A) SCs expressing GFP-mfas gene trap and either no other transgene, or wild type Aβ-42-peptide, or either the Iowa or Dutch mutant Aβ-42 peptides. White asterisks and white boxes marked with asterisks indicate DCG compartments with acidification phenotype (lower Zoom panel; red arrowheads mark acidic microdomains). Blue arrowheads mark mini-cores. (B) Schematic showing different Aβ-42 peptides tested. (CE) Bar charts showing DCG compartment number (C), proportion of compartments with a mini-core phenotype (D), and proportion of large compartments with DCG acidification phenotype (E). (F, G) Stills from time-lapse movies of DCG biogenesis in SCs expressing GFP-mfas gene trap with Dutch (F) or Iowa (G) Aβ-42 mutant, focusing on one compartment as it forms mini-cores (Merge, Box 1) and another mature compartment (Box 2). Note compartments and mini-cores are relatively immobile (two mini-cores marked by purple and orange arrowheads [Box 2]). In all images, n nuclei; LysoTracker Red (magenta) marks acidic compartments in (A). Scale bars = 5 and 1 µm in Zoom. For bar charts, data are mean ± SEM, analysed using the Kruskal–Wallis test; n = animal number above bar, *P < 0.05, ***P < 0.001, ****P < 0.0001, ns not significant. In (C), w1118 vs Aβ-Iowa, P = 0.0013; Aβ-WT vs Aβ-Dutch, P = 0.012. In (D), Aβ-WT vs Aβ-Dutch, P = 0.0002; Aβ-WT vs Aβ-Iowa, P = 0.018. In (E), w1118 vs Aβ-WT, P = 0.0008; w1118 vs Aβ-Dutch, P = 0.0011. See also Fig. EV5; Appendix Figs. S6–S9; Movies EV5 and EV6. Source data are available online for this figure.
Figure 7
Figure 7. Schematic model of APPL-regulated DCG formation in Drosophila secondary cells.
Schematic shows DCG assembly process in control conditions (top row) with large central DCG (green) forming from peripheral mini-cores that interact with both the compartment’s limiting membrane and ILVs. Formation of protein aggregates detectable by DIC requires a Rab6 to Rab11 transition (Wells et al, 2023), and assembly of a large central DCG involves clustering of ILVs regulated by GAPDH (Dar et al, 2021). Appl knockdown or pathological (Dutch) mutant Aβ-42 expression suppresses coalescence of mini-cores, increases lysosomal targeting, but also suppresses secretory compartment motility, presumably by stabilising cytoskeletal interactions. GFP-MFAS is more readily endocytosed by main cells, when non-cleavable forms of APPL or Aβ-peptides are expressed, leading to lysosomal enlargement in these cells. The APPL-ΔsdE1 mutant also promotes limiting membrane-associated MFAS aggregation, producing a peripheral network.
Figure EV1
Figure EV1. Drosophila MFAS selectively drives DCG assembly in SCs, related to Fig. 1.
(AC) Ex vivo, wide-field fluorescence micrographs and DIC images of SCs from 6-day-old males expressing SC-specific rosy-RNAi or either of two independent mfas-RNAis with the GFP-mfas gene trap (A), YFP-Rab11 (B) or CFP-Rab6 (C). Rab-positive ILVs (green arrowheads) in compartments are marked in Zoom panels. In mfas knockdown cells, sporadic intra-compartmental puncta detected by DIC, which are often Rab-positive, are marked with grey arrowheads. (D) Bar chart of DCG compartment number shows that expressing rosy-RNAi in adult SCs using the tub-GAL80ts; dsx-GAL4, GFP-mfas SC-specific GAL4 driver line has no effect relative to controls. (E) Stills from a time-lapse movie of DCG biogenesis and DCG acidification in SC from a 6-day-old male expressing GFP-mfas gene trap. For the compartment marked by the white box (top row of zoomed images), a single DCG forms rapidly from a GFP-MFAS cloud. For compartment marked by white box and asterisk (bottom row), small LysoTracker Red-positive compartments (red arrowheads) contact and spread around the periphery of the DCG compartment, then start to acidify the lumen around the DCG (66 min) before rapid dispersion of the core (67.5 min; GFP and by DIC). Purple arrowhead marks DCG; it can persist for 20 min following the start of the acidification process. td-GFP-mfas = tub-GAL80ts/+; dsx-GAL4, GFP-mfas/+. (F, G) Knockdown of mfas with two independent RNAis has no effect on the number of Rab6-positive large compartments (F) or the proportion of these compartments containing Rab6-positive ILVs (G). (H) Knockdown of mfas in SCs expressing GFP-GPI, a DCG and a membrane marker, produces compartments with GFP at the limiting membrane, like controls and with internal concentrations of GFP in puncta that are also detected by DIC (grey arrowhead). (I) Bar charts showing proportion of large compartments with DCG acidification phenotype (E) in GFP-MFAS-expressing knockdown SCs. In all images, approximate cell boundaries and compartment boundaries are marked with a dashed white line; n = nuclei of binucleate cells; LysoTracker Red (magenta) marks acidic compartments. Scale bars = 5 and 1 µm in Zoom. For bar charts, data are mean ± SEM, analysed using the Kruskal–Wallis test, followed by Dunn’s multiple comparisons post hoc test; n = animal number above bar, ***P < 0.001, ns not significant. In (I), rosy vs mfas #1, P = 0.0010; rosy vs mfas #2, P = 0.0009.
Figure EV2
Figure EV2. Drosophila APPL regulates formation of large DCGs in SCs, related to Fig. 3.
(A) SCs expressing GFP-mfas gene trap and SC-specific rosy-RNAi or Appl-RNAi #2 (top two rows), or without additional transgenes, but in a control w1118 or Appld mutant background (bottom two rows). Note that following knockdown of Appl, large secretory compartments contain multiple mini-cores (blue arrowheads), labelled with GFP-MFAS and visible by DIC (white box and upper Zoom panel). Appld mutant SCs contain distorted DCGs that frequently contact the compartment’s limiting membrane and sporadic mini-cores (white box, top Zoom panel). The DCG acidification phenotype is also more commonly observed in Appl knockdown and Appl mutant backgrounds (white asterisks and white boxes marked by asterisks, shown in lower Zoom panels; red arrowheads mark acidic microdomains). DCGs that have not yet been dissipated are marked with light blue arrowheads. (B, C) SCs expressing SC-specific rosy-RNAi or either of two independent Appl-RNAis with YFP-Rab11 (B) or CFP-Rab6 (C). Zoom panels show mini-core phenotype (white box, top panel) with intra-compartmental Rab puncta (green arrowheads), and DCG acidification phenotype with no Rab association (white box marked with an asterisk, bottom panel). (DG) Bar charts showing numbers of Rab11-positive (D) or Rab6-positive (F) large compartments, and proportion of these compartments containing Rab11-positive (E) or Rab6-positive (G) ILVs in SCs with knockdown of Appl using two independent RNAis versus controls. (HK) Bar charts comparing the effects of the Appld null mutant with SC-specific knockdown of Appl and controls. Appld typically does not affect DCG compartment number (H) or induce mini-core formation, but DCGs are often deformed (I) and touch the compartment’s limiting membrane (K). The DCG acidification phenotype is particularly prominent in Appld SCs (J). (L) Bar chart showing DCG phenotypes induced by APP-YFP expression with and without Appl knockdown versus control SCs. Note that in Appl knockdown cells rescued by APP-YFP, about 10% of DCGs are mis-assembled, lacking GFP-MFAS at their centre (GFP-centre), perhaps because high-efficiency APP-YFP cleavage is required to prime the aggregation of proteins at the centre of all compartments in this genetic background. In all images, n nuclei; LysoTracker Red (magenta) marks acidic compartments. Scale bars = 5 and 1 µm in Zoom. For bar charts, data are mean ± SEM, analysed using the Kruskal–Wallis test; n = animal number above bar, *P < 0.05, **P < 0.01, ***P < 0.001, ****P < 0.0001, ns not significant. In (I), w1118 vs Appld, P = 0.014; Appld vs Appl #1, P = 0.0004. In (J), w1118 vs Appl #1, P = 0.0070; Appld vs Appl #1, P = 0.0002. In (K), w1118 vs Appld, P = 0.032; Appld vs Appl #1, P = 0.024. In (L), rosy vs Rescue (GFP-centre), P = 0.0001; rosy vs Rescue (Mini-/deformed), P = 0.0058.
Figure EV3
Figure EV3. Secretases involved in Drosophila APPL processing regulate DCG maturation, related to Fig. 5.
(A) SCs expressing GFP-mfas gene trap and SC-specific rosy-RNAi or RNAi targeting α-, β- and γ-secretases. Note β-secretase knockdown affects DCG morphology, so that GFP-MFAS is frequently absent from a large central region within the DCG, while other secretase knockdowns rarely affect DCG morphology (shown for compartments outlined with white boxes in upper Zoom). White asterisks and white boxes marked with asterisks in the Merge channel indicate DCG compartments with acidification phenotype (lower Zoom; red arrowheads mark acidic microdomains). (BE) Bar charts showing effects of knockdowns on the number of DCG compartments (B), and proportion of abnormal DCGs (C). A greater proportion of large compartments display the DCG acidification phenotype following secretase knockdown than in controls (D). The different DCG phenotypes observed following knockdown of α-, β- and γ-secretases are categorised in (E). Note that β-secretase knockdown induces the formation of DCGs that lack GFP-MFAS at their centre. In all images, n nuclei; LysoTracker Red (magenta) marks acidic compartments. Scale bars = 5 and 1 µm in Zoom. For bar charts, data are mean ± SEM, analysed using the Kruskal–Wallis test; n = animal number above bar, **P < 0.01, ***P < 0.001, ****P < 0.0001, ns not significant. In (D), rosy vs α-sec, P = 0.0009. In (E), rosy vs β-sec (GFP-centre), P = 0.0008; rosy vs β-sec (Mini-/deformed), P = 0.0048.
Figure EV4
Figure EV4. Drosophila APPL and its cleavage regulate normal DCG formation, and the uptake of GFP-MFAS by other cells, related to Fig. 5.
(A) Bar chart showing that overexpression of APPL-WT, APPL-Δsd and APPL-ΔsdE1 produces abnormal DCGs, with APPL-ΔsdE1 generating a unique network phenotype. (B) SCs expressing GFP-mfas gene trap and APPL-ΔsdE1 (Fig. 4B). Note two abnormal DCG compartments that have a central abnormally shaped DCG, but also contain peripheral GFP-MFAS aggregates (blue arrowheads in compartments outlined with white boxes shown in Zoom panels). (C) SCs and surrounding main cells expressing GFP-mfas gene trap alone or with wild-type APPL (APPL-WT), APPL-Δsd or APPL-ΔsdE1 in SCs. Note for mutant APPL expression, abnormal accumulation of GFP-MFAS in main cell compartments that typically exhibit limited LysoTracker Red staining (compartments outlined by orange dashed lines); one example is outlined by a white box and shown in Zoom panels (DIC alone and DIC/Merge; red arrowheads mark acidic microdomains). In all images, n = nuclei; LysoTracker Red (magenta) marks acidic compartments in (B, C). Scale bars = 5 and 1 µm in Zoom. For bar charts, data are mean ± SEM, analysed using the Kruskal–Wallis test; n = animal number above bar, *P < 0.05, ****P < 0.0001, ns not significant. In (A), Appl-WT vs Appl-ΔsdE1 (Abnormal), P = 0.015.
Figure EV5
Figure EV5. Aβ-42-peptide expression in SCs promotes uptake of GFP-MFAS by other accessory gland cells, related to Fig. 6.
(A) SCs and surrounding main cells expressing GFP-mfas gene trap alone or with wild-type Aβ-42-peptide, or either the Iowa or Dutch mutant Aβ-42 peptides. Note for Aβ-42-peptide expression, abnormal accumulation of GFP-MFAS in main cell compartments that typically exhibit limited LysoTracker Red staining (compartments outlined by orange dashed lines); one example is outlined by a white box and shown in Zoom panels (DIC alone and DIC/Merge; red arrowheads mark acidic microdomains). (B) Bar chart showing the accumulation of GFP-MFAS in main cells of 6-day-old males overexpressing SC-specific wild type Aβ-42-peptide, or either the Iowa or Dutch mutant Aβ-42 peptides or w1118 controls, expressed as percentage of total main cell area that contains GFP. In all images, n nuclei; LysoTracker Red (magenta) marks acidic compartments in (A). Scale bars = 5 and 1 µm in Zoom. For the bar chart, data are mean ± SEM, analysed using the Kruskal–Wallis test; n =  animal number above bar, *P < 0.05, **P < 0.01, ns = not significant. In (B), w1118 vs Aβ-WT, P = 0.0029; w1118 vs Aβ-Dutch, P = 0.011; w1118 vs Aβ-Iowa, P = 0.048.

References

    1. Acquasaliente L, De Filippis V (2022) The role of proteolysis in amyloidosis. Int J Mol Sci 24:699 - PMC - PubMed
    1. Ashley J, Packard M, Ataman B, Budnik V (2005) Fasciclin II signals new synapse formation through amyloid precursor protein and the scaffolding protein dX11/Mint. J Neurosci 25:5943–5955 - PMC - PubMed
    1. August A, Schmidt N, Klingler J, Baumkötter F, Lechner M, Klement J, Eggert S, Vargas C, Wild K, Keller S et al (2019) Copper and zinc ions govern the trans-directed dimerization of APP family members in multiple ways. J Neurochem 151:626–641 - PubMed
    1. Bignante EA, Heredia F, Morfini G, Lorenzo A (2013) Amyloid β precursor protein as a molecular target for amyloid β-induced neuronal degeneration in Alzheimer’s disease. Neurobiol Aging 34:2525–2537 - PMC - PubMed
    1. Bolkan BJ, Triphan T, Kretzschmar D (2012) β-secretase cleavage of the fly amyloid precursor protein is required for glial survival. J Neurosci 32:16181–16192 - PMC - PubMed

MeSH terms

LinkOut - more resources