. 2025 Jul 17;82(1):276.
doi: 10.1007/s00018-025-05810-w.

LRRK2 kinase modulates glucose-stimulated insulin secretion via RAB8 phosphorylation and ciliogenesis

Affiliations

LRRK2 kinase modulates glucose-stimulated insulin secretion via RAB8 phosphorylation and ciliogenesis

Nevia Dule et al. Cell Mol Life Sci. .

Abstract

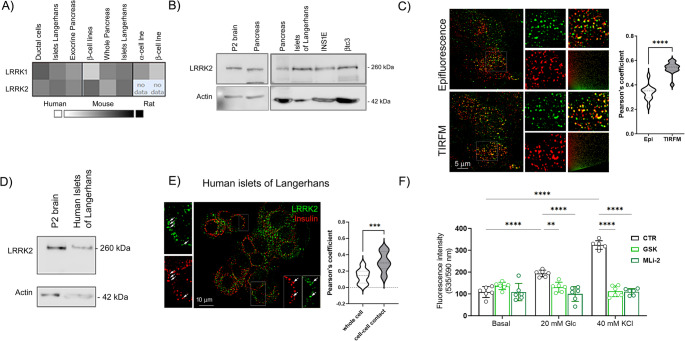
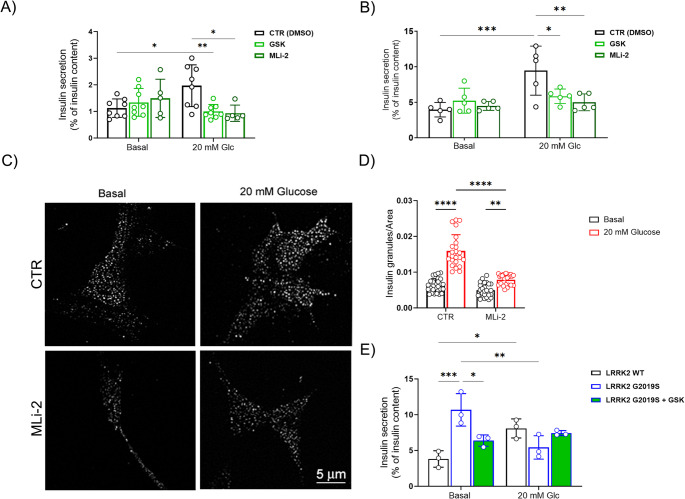
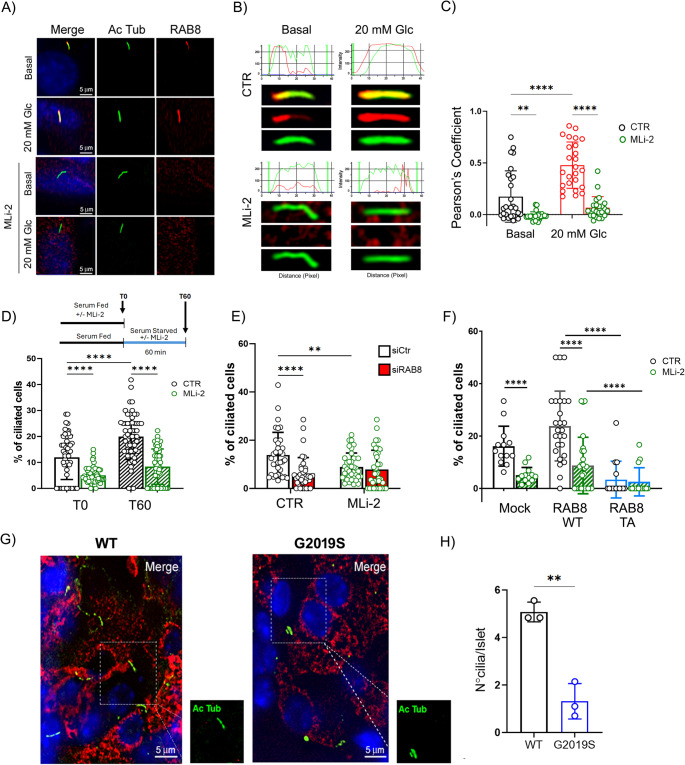
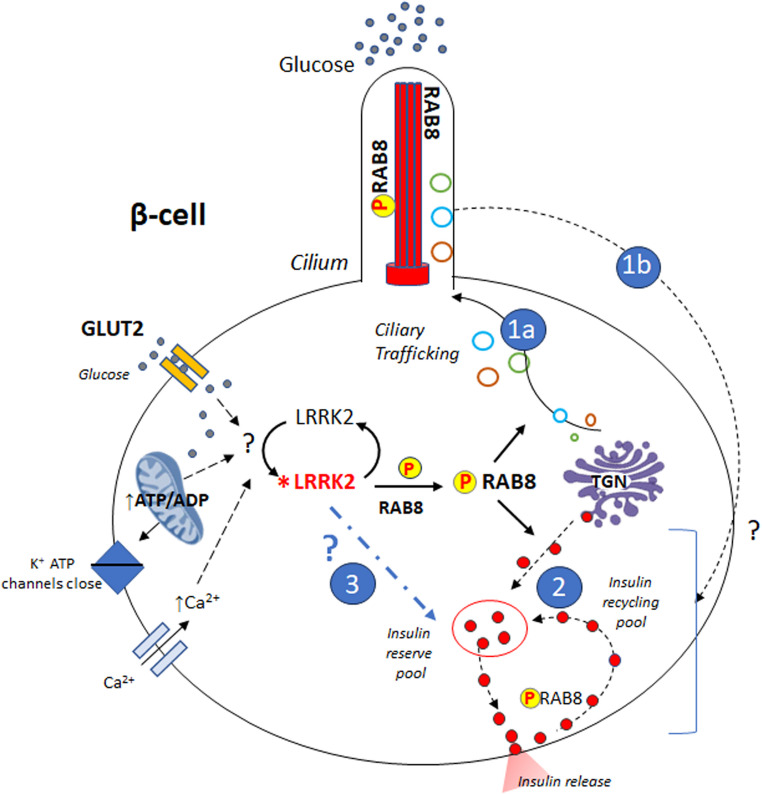
Leucine-rich repeat kinase 2 (LRRK2) encodes a multidomain protein whose mutations have been identified as genetic risk factors for Parkinson's disease (PD), an age-related neurodegenerative disorder. Outside the nervous system, LRRK2 is expressed in multiple tissues, including the endocrine pancreas, but its role here is unknown. Using pharmacological and molecular approaches, we show that LRRK2 kinase activity regulates stimulated insulin secretion by influencing secretory granule trafficking. The PD-associated LRRK2 mutant G2019S, characterized by enhanced kinase activity, increases the basal insulin release in complementary in vitro models and affects the metabolic profile in transgenic mice. Mechanistically, we demonstrate that LRRK2 kinase activity influences the formation of the primary cilium, an antenna-like structure acting as signaling platform to regulate hormones secretion. Specifically, LRRK2 phosphorylates RAB8 in a glucose-dependent manner, facilitating its recruitment to the primary cilium. These findings identify LRRK2 as a regulator of insulin secretion in pancreatic β-cells. Given the role of insulin signaling and glucose homeostasis in the nervous system, our data suggest that LRRK2 may also contribute to PD development through peripheral action.

Keywords: Insulin; LRRK2; β-cell; RABs; Parkinson disease; Primary cilium.


Conflict of interest statement

Declarations. Competing interests: The authors declare that they have no competing interests. Ethics approval: Animal protocols were approved by the University of Trento and National Ministry of Health (IACUC 793/2016-PR).

Figures

Fig. 1
Fig. 1
LRRK2 G2019S mice exhibit altered metabolic profile and impaired insulin secretion. A-C Quantitative analysis of A body weight (gr), B blood glucose (mg/dL), and C circulating insulin (µg/L) in LRRK2 WT and G2019S mice (n = 13 WT and 14 G2019S mice). Blood glucose and insulin levels were measured under fasting conditions (6 h, light cycle). Data are reported as mean ± SD. Unpaired Student’s T-test: *p < 0.05; ** p < 0.01. D Representative immunofluorescence images of islets of Langerhans from LRRK2 WT and G2019S mice stained with anti-insulin (red), anti-glucagon (green), and anti-somatostatin (blue) antibodies. Scale bar: 40 μm. E Size area (µm2) of islets of Langerhans from LRRK2 WT and G2019S mice (n = 5 mice/group). Data are reported as mean ± SD. Unpaired Student’s T-test: *p < 0.05. F Glucose-stimulated (20 mM) insulin secretion in islets of Langerhans isolated from LRRK2 WT and G2019S mice (n = 3 independent experiments in triplicate). Data are reported as mean ± SD. Two-way ANOVA: *p < 0.05, **p < 0.01. G Stimulatory index of insulin secretion. Data (mean ± SD) are expressed as stimulated over basal release (n = 3 independent experiments in triplicate). Unpaired Student’s T-test: * p < 0.05
Fig. 2
Fig. 2
LRRK2 is expressed in the endocrine pancreas and is involved in insulin release in βtc3 cells. A Expression of LRRK2 gene in human, mouse, and rat pancreas according to the T1D Protein Atlas database http://T1DBase.org [38]. B Western blot of LRRK2 expression in murine pancreas, isolated murine islets of Langerhans, and rodent β-cell lines (βtc3 and INS1E). Mouse P2 brain fraction was used as positive control. Actin was used as loading control. C Representative immunofluorescence images of βtc3 cells double stained with anti-insulin (red) and anti-LRRK2 (green) antibodies visualized by epifluorescence and TIRFM. The colocalization between LRRK2 and insulin is shown in yellow. Scale bar: 5 μm. Particulars are shown at higher magnification (3X). The Pearson’s coefficient of colocalization between insulin and LRRK2 in epifluorescence and TIRFM images is reported (n = at least 12 images). Data are reported as mean ± SD. Unpaired Student’s T-test: ****p < 0.001. D Western blot of LRRK2 expression in isolated human islets. Mouse P2 brain fraction was used as positive control. Actin was used as a loading control. E Representative immunofluorescence image of a human islet double stained with anti-insulin (red) and anti-LRRK2 (green) antibodies. Colocalization is shown in yellow. Scale bar: 10 μm. Particulars are shown at higher magnification (2X), arrows indicate superimposable vesicles. The Pearson’s coefficient of colocalization between insulin and LRRK2 in ROIs located on the whole insulin-positive cell or at cell-cell contact sites is reported (n = 24 ROIs in 4 different islet images). Data are reported as mean ± SD. Unpaired Student’s T-test: ***p < 0.005. F Vesicle trafficking under basal (1 mM glucose) and stimulated (20 mM glucose or 40 mM KCl) conditions was evaluated in βtc3 cells in the absence (CTR - DMSO) or presence of LRRK2 kinase activity inhibitors (200 nM GSK and 10 nM MLi-2) by using an acridine orange assay (n = 6 independent experiments). Data are reported as mean ± SD. Two-way ANOVA: **p < 0.01; ****p < 0.001
Fig. 3
Fig. 3
LRRK2 controls the glucose-stimulated insulin secretion through its kinase activity. A Glucose-stimulated (20 mM) insulin secretion in βtc3 cells incubated in the absence (CTR - DMSO) or presence of the LRRK2 kinase inhibitors GSK (200 nM) or MLi-2 (10 nM) (n = at least 5 independent experiments). Data are expressed as percentage of insulin content and are reported as mean ± SD. Two-way ANOVA: * p < 0.05, **p < 0.01. B Glucose-stimulated (16.7 mM) insulin secretion in isolated human islets incubated in the absence (CTR - DMSO) or presence of the LRRK2 kinase inhibitors GSK (200 nM) and MLi-2 (10 nM) (n = 5 independent experiments). Data are expressed as percentage of insulin content and are reported as mean ± SD. Two-way ANOVA: *p<0.05, **p < 0.01, ***p < 0.005. C Representative images of insulin granules density in the TIRF zone (100 nm) under basal (1 mM glucose) and stimulated (20 mM glucose) conditions in βtc3 cells incubated with 10 nM MLi-2 or DMSO (CTR) for 45 min. After treatments, cells were fixed and stained with anti-insulin antibody. Scale bar: 5 μm. D Quantitative analysis of insulin granules in the TIRF zone in control and MLi-2 treated βtc3 cells. Data are normalized for the cell area and are reported as mean ± SD. Each dot represents the average granule density in one cell (n = 22 cells). Two-way ANOVA: **p < 0.01, ****p < 0.001. E Glucose-stimulated (20 mM) insulin secretion in βtc3 cells expressing LRRK2 WT or G2019S constructs. Insulin secretion was evaluated in the presence or absence of the LRRK2 kinase inhibitor GSK (200 nM) in G2019S-transfected cells (n = 3 independent experiments). Data are expressed as percentage of insulin content and are reported as mean ± SD. Two-way ANOVA: *p < 0.05, **p < 0.01, ***p < 0.005
Fig. 4
Fig. 4
RAB8 is phosphorylated by LRRK2, and its phosphorylation promotes insulin release. A Full-length RFP-LRRK2 was expressed in βtc3 cells, and the recombinant protein was isolated on the RFP-selector resin (RFP-resin). A control-selector resin (Ctr-Resin) was used to detect unspecific binding. Interacting proteins were resolved by western blotting analysis with the anti-RAB8 antibody. B Western blot analysis of RAB8 phosphorylation on the threonine 72 residue at different time points after glucose stimulation (20 mM), in the presence or absence of LRRK2 kinase inhibitor MLi-2 (10 nM, 45 min pre-treatment) and C relative quantification (n = at least 3 independent experiments). Actin was used as loading control. Data are expressed as Phospho-RAB8 over RAB8 and are reported as mean ± SD. Two-way ANOVA: **p < 0.01; ****p < 0.001. D Glucose-stimulated (20 mM) insulin secretion in βtc3 cells transfected with WT RAB8 and T72A mutant. Data are expressed as percentage of insulin content and values are reported as mean ± SD (n = 6 experiments). Two-way ANOVA: *p < 0.05; ***p < 0.005; ****p < 0.001. E Quantitative analysis of insulin granule trafficking in the TIRF zone in βtc3 cells cotransfected with GFP-insulin and WT RAB8 and T72A mutant at different time points after glucose (20 mM) and KCl (40 mM) stimulations. Data are normalized on cell area and are reported as mean ± SD. Two-way ANOVA. **p < 0.01; ****p < 0.001 vs WT RAB8, same time point; °°p < 0.01, vs 0’ WT RAB8 (n = at least 3 independent experiments). F Representative immunofluorescence images of βtc3 cells triple stained with DAPI (blue), anti-RAB8 (green) and anti-insulin (red) antibodies under basal (1 mM glucose) and stimulated (20 mM glucose) conditions. Scale bar: 5 μm
Fig. 5
Fig. 5
RAB8 phosphorylation impacts primary cilia formation. A Representative immunofluorescence images of βtc3 cells triple stained with DAPI (blue), anti-acetylated α-tubulin (green) and anti-RAB8 (red) antibodies. βtc3 cells under basal (1 mM glucose) and stimulated (20 mM glucose) conditions were incubated with/without the LRRK2 kinase inhibitor MLi-2 (10 nM; 60 min treatment). The colocalization between acetylated tubulin and RAB8 is shown in yellow/orange. Scale bar: 5 μm. B Fluorescent intensity profile of acetylated tubulin (green) and RAB8 (red) in the representative cilia of panel A (4x magnification). C The colocalization between acetylated tubulin and RAB8 was quantified by means of Pearson’s coefficient analysis (n = at least 23 cells per condition). Data are reported as mean ± SD. Two-way ANOVA: **p < 0.01; ****p < 0.001. D Quantification of ciliated βtc3 cells at 0 and 60 min after serum withdrawal, in the presence or absence of MLi-2 (10 nM for 60 min) (1 mM glucose) (n = at least 60 image fields per condition). A timeline of the treatments is depicted. Data are reported as mean ± SD. Two-way ANOVA: ****p < 0.001. E Quantification of ciliated βtc3 cells after RAB8 silencing using an siRNA strategy, following a 60-minute incubation in serum-starved conditions plus 1 mM glucose, in the presence or absence of MLi-2 (10 nM; 60 min treatment) (n = 37 image fields per condition). Data are reported as mean ± SD. Two-way ANOVA: **p < 0.01; ****p < 0.001. F Quantification of ciliated βtc3 cells overexpressing WT RAB8 or the T72A mutant in serum-fed and 1 mM glucose conditions in the presence or absence of MLi-2 (10 nM; 60-minute treatment) (n = at least 10 image fields per condition). Data are reported as mean ± SD. Two-way ANOVA: ****p < 0.001. G Representative immunofluorescence images of mouse islets from LRRK2 WT and G2019S mice triple stained with anti-acetylated tubulin (green), anti-insulin (red) antibodies and DAPI (blue). Scale bar: 5 μm. H Quantification of cilia number in islets of Langerhans from LRRK2 WT and G2019S mice (n = 3 mice/group; at least 12 islets per mouse). Data are reported as mean values ± SD. Unpaired Student’s T-test: ** p < 0.01
Fig. 6
Fig. 6
Molecular model of LRRK2 action on insulin secretion in pancreatic β-cells. The data indicate that the LRRK2 kinase, following exposure to high glucose (stimulated condition), phosphorylates RAB8 at threonine 72. Once phosphorylated, RAB8 (P-RAB8) promotes insulin secretion via two possible, non-mutually exclusive mechanisms. (1) Indirect mechanism mediated by the primary cilium. Phospho-RAB8 would control the trafficking towards the cilium of vesicles containing proteins that are critical for its formation and function (1a), thereby promoting the regulated insulin secretion by a mechanism that is still poorly understood (1b). (2) Direct mechanism, mediated by the action of phospho-RAB8 on insulin granules. In this case, P-RAB8 could directly promote the trafficking of insulin granules from the TGN (or recycling pool) to the plasma membrane and the hormone secretion. (3) Although not addressed in the study, activation of LRRK2 may promotes insulin secretion also through RAB8 independent pathways. *LRRK2 indicates active LRRK2. Dotted lines indicate not yet identified pathways

References

    1. Cookson MR (2010) The role of leucine-rich repeat kinase 2 (LRRK2) in parkinson’s disease. Nat Rev Neurosci 11:791–797. 10.1038/nrn2935 - PMC - PubMed
    1. Monfrini E, Di Fonzo A (2017) Leucine-Rich repeat kinase (LRRK2) genetics and parkinson’s disease. Adv Neurobiol 14:3–30. 10.1007/978-3-319-49969-7_1 - PubMed
    1. Obeso JA, Stamelou M, Goetz CG et al (2017) Past, present, and future of parkinson’s disease: A special essay on the 200th anniversary of the shaking palsy. Mov Disord 32:1264–1310. 10.1002/mds.27115 - PMC - PubMed
    1. Goldwurm S, Di Fonzo A, Simons EJ et al (2005) The G6055A (G2019S) mutation in LRRK2 is frequent in both early and late onset parkinson’s disease and originates from a common ancestor. J Med Genet 42:e65. 10.1136/jmg.2005.035568 - PMC - PubMed
    1. Greggio E, Jain S, Kingsbury A et al (2006) Kinase activity is required for the toxic effects of mutant LRRK2/dardarin. Neurobiol Dis 23:329–341. 10.1016/j.nbd.2006.04.001 - PubMed

MeSH terms