. 2025 Oct;99(10):4227-4242.
doi: 10.1007/s00204-025-04121-0. Epub 2025 Jul 17.

Alignment between Duplex Sequencing and transgenic rodent mutation assay data in the assessment of in vivo NDMA-induced mutagenesis

Affiliations

Alignment between Duplex Sequencing and transgenic rodent mutation assay data in the assessment of in vivo NDMA-induced mutagenesis

Anne L Ashford et al. Arch Toxicol. 2025 Oct.

Abstract

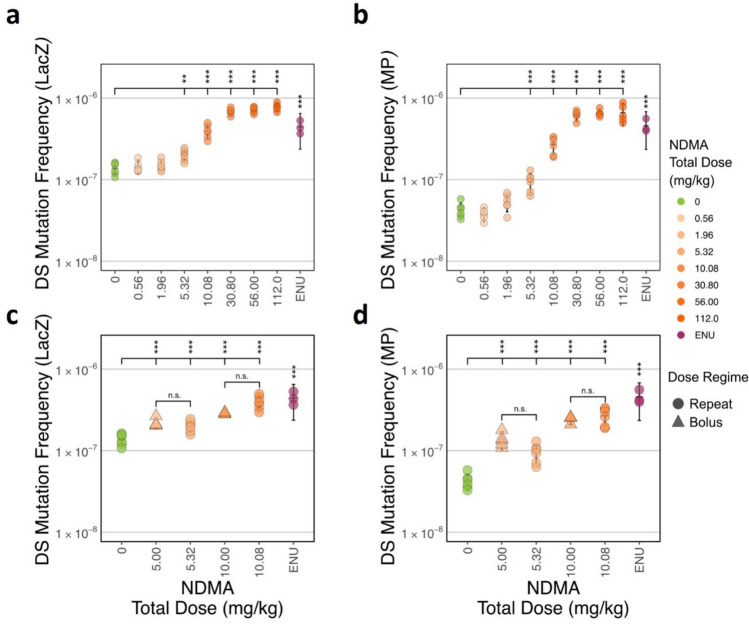
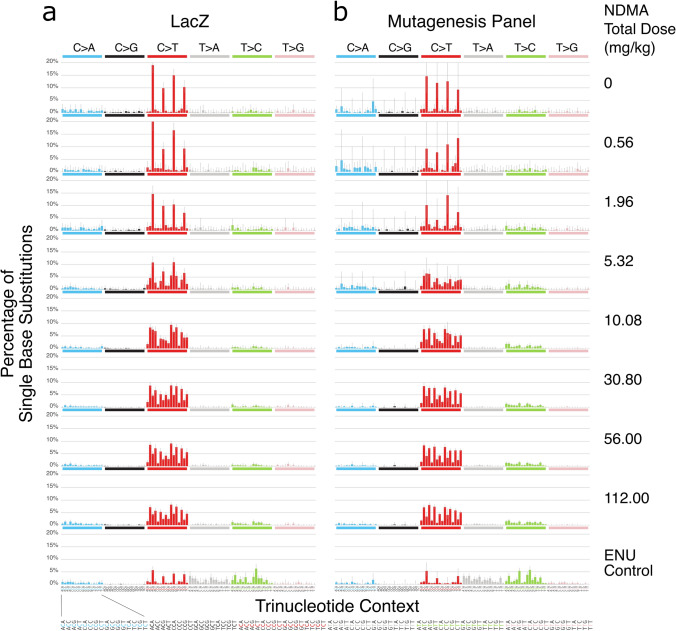
The nitrosamine N-nitrosodimethylamine (NDMA) is a mutagen and rodent carcinogen that has been identified as a process impurity in some commercially available medicines, leading to market withdrawals and new impurity control measures. Error-corrected DNA sequencing techniques, such as Duplex Sequencing (DS), have error rates low enough to revolutionise genetic toxicology testing by directly measuring in vivo mutagenesis within days of exposure. Here, DS was performed on liver samples from an OECD-compliant, Transgenic Rodent Gene Mutation Assay (TGR) conducted under GLP standards. Muta™Mouse specimens were orally dosed with NDMA using either a repeat-dose 28-day regimen (0.02-4 mg/kg(bw)/day) or single bolus doses of either 5 or 10 mg/kg(bw) administered on day 1. Dose-dependent increases in mutation frequency were detected by DS in liver, enabling a No-Observed Genotoxic Effect Level (NOGEL) of 0.07 mg/kg(bw)/day to be determined, supported by mechanistic analyses of trinucleotide mutation spectra. Benchmark dose (BMD) modelling determined similar BMD50 values for both DS or TGR, demonstrating concordance across the two techniques albeit with greater precision from DS due to smaller inter-animal variation. DS offers a fundamental change in mutagenicity assessments enabling more precise point-of-departure determinations with mechanistic clarity and 3Rs advantages compared to the standard TGR approach.

Keywords: Benchmark dose; Error-corrected sequencing; Genetic toxicology; Nitrosamine; Non-clinical safety.


Conflict of interest statement

Declarations. Competing interests: AA, AD, FD and JE are employees of AstraZeneca and have shares in AstraZeneca. DN, JEH, JS, KV and TS were employed at TwinStrand Biosciences at the time the work was conducted and JEH, KV and TS have shares in TwinStrand Biosciences. JS is the founder, and has shares in, TwinStrand Biosciences and receives Duplex Sequencing Patent Royalties from the University of Washington. AL, JH and JW are employees of GSK and have shares in GSK. Ethics statement: All animal studies were ethically reviewed and carried out in accordance with Animals (Scientific Procedures) Act 1986 and the GSK Policy on the Care, Welfare and Treatment of Animals.

Figures

Fig. 1
Fig. 1
Dose-dependent mutation frequency induction in the Muta™Mouse liver following NDMA exposure using Duplex Sequencing. Panels a and c display mutation frequencies (MFs) from Duplex Sequencing (DS) of the LacZ Panel, whilst panels b and d show results from the Mouse Mutagenesis (MP) panel. a and b illustrate repeat dosing only, whilst c and d include both repeat and bolus dosing. MF are shown across varying NDMA doses, with ENU as a positive control. Statistical significance is denoted by ***p < 0.001, **p < 0.01, *p < 0.05, and n.s. not significant, with error bars representing 95% confidence intervals calculated using a t-distribution
Fig. 2
Fig. 2
Comparison of TGR Muta™Mouse and Duplex Sequencing of the same liver tissues. Panels A and B show the correlation between TGR mutant frequency and Duplex Sequencing (DS) mutation frequency for a the lacZ panel and b Mouse Mutagenesis panel (MP). TGR measures the proportion of lacZ genes that harbour a functional mutation whereas Duplex Sequencing directly measures the frequency of all mutations (see text). The shaded grey areas represent the 95% confidence intervals. Pearson correlation coefficients (ρ) and p values are indicated. Panels c and d display the in-group variability (standard deviation) of log-transformed mutation frequencies for DS and TGR assays. Panel c uses the “min” method to correct for clonality, where identical mutations at the same position are counted only once, whilst panel d uses the “max” method, counting multiple identical mutations at the same position (potential clones) as independent mutation events. Statistical significance is denoted by *p < 0.05 and **p < 0.01, with error bars representing 95% confidence intervals calculated using a t-distribution
Fig. 3
Fig. 3
Comparison of benchmark dose estimates from TGR or DS methods. a, b Four-model average, benchmark dose modelling fits to the dose–response data from a TGR (lacZ transgene) or b DS (lacZ panel). A fixed critical-effect size of 50% was used for both TGR and DS endpoints and 1000 bootstrap simulations were run. The points clustered along the X-axis show the estimated critical-effect dose (CED) from each bootstrap run. The CEDL and CEDU values represent the lower and upper 90% confidence interval of the CED, (respectively). c Distributions (histograms) and 90% confidence intervals (horizontal lines) of the CED estimates. Whereas the CED estimates from the TGR and ecNGS methods overlapped, ecNGS yielded a narrower distribution (i.e., greater precision) positioned at the left-end (i.e. more sensitive) of the results from the TGR method
Fig. 4
Fig. 4
Proportions of single base substitution types in Muta™Mouse liver following NDMA exposure using Duplex Sequencing. Stacked bar plots display the proportions of single base substitutions across varying doses of NDMA and a positive control (ENU) using Duplex Sequencing of a the lacZ panel and b Mouse Mutagenesis panel. The colour key to the right of the panels identifies the substitution types
Fig. 5
Fig. 5
Correction for trinucleotide context content to predict mutation frequency and substitution types in Muta™Mouse liver. Correlation of trinucleotide context abundance from a the Mutagenesis panel and b the lacZ panel with endogenous mouse genome. The colour key identifies the trinucleotide context for each data point. c Comparison between DS Mutation Frequency using mutagenesis panel (MP) and for real data from the lacZ panel (lacZ Real), as well as MP data adjusted for trinucleotide context abundance differences between the panels (lacZ Predicted). d Correlation of DS mutation frequencies between real and predicted data for the lacZ panel, with NDMA total doses indicated in the colour key. e Proportions of single base substitution types from the Mutagenesis panel and for real and predicted data lacZ panels. The colour key to the right of the panels identifies the substitution types. Statistical significance is denoted by ***p < 0.001 and **p < 0.01
Fig. 6
Fig. 6
Trinucleotide mutation spectra induced by NDMA of Muta™Mouse liver using Duplex Sequencing of lacZ and Mutagenesis panel. Mutation spectra using a the lacZ panel and b the mutagenesis panel at various total doses of NDMA compared to the ENU control. Each panel represents the pooled mutation spectrum across animals at a specific dose, with mutations categorised by trinucleotide context. The x-axis in each panel represents the sequence context of the mutated base, whilst the y-axis represents the frequency of the mutations, corrected for sequencing depth at the relevant trinucleotide context abundance
Fig. 7
Fig. 7
Comparison between trinucleotide spectra across treatment groups using Duplex Sequencing of the Mouse Mutagenesis panel. a Heatmap illustrating the cosine similarity between trinucleotide mutation spectra of different NDMA total dose groups, controls and several reference mutational signatures. Comparative reference mutational signature includes NDMA from Armijo et al. , ENU from the Signal Database and SBS1 and SBS11 from COSMIC (v3.4). The colour scale represents cosine similarity values, ranging from 0 (low similarity) to 1 (high similarity). Hierarchical clustering on the row groups the treatment conditions based on similarity. b Statistical analysis table showing comparison between trinucleotide spectra of NDMA-treated groups and the VC spectra. The table includes Fisher Exact adjusted p values and statistical significance annotations (n.s. for not significant, *** for p < 0.001) for each dose group

References

    1. Armijo AL, Thongararm P, Fedeles BI et al (2023) Molecular origins of mutational spectra produced by the environmental carcinogen N-nitrosodimethylamine and S(N)1 chemotherapeutic agents. NAR Cancer 5(2):zcad015. 10.1093/narcan/zcad015 - PMC - PubMed
    1. Bercu JP, Zhang S, Sobol Z, Escobar PA, Van P, Schuler M (2023) Comparison of the transgenic rodent mutation assay, error corrected next generation duplex sequencing, and the alkaline comet assay to detect dose-related mutations following exposure to N-nitrosodiethylamine. Mutat Res Genet Toxicol Environ Mutagen 891:503685. 10.1016/j.mrgentox.2023.503685 - PubMed
    1. Delker DA, Geter DR, Kleinert KM, Gollapudi BB (2008) Frequency and spectrum of lacI mutations in the liver of Big Blue mice following the administration of genotoxic carcinogens singly and in series. Int J Toxicol 27(1):35–42. 10.1080/10915810701876620 - PubMed
    1. Dodge AE, LeBlanc DPM, Zhou G et al (2023) Duplex sequencing provides detailed characterization of mutation frequencies and spectra in the bone marrow of MutaMouse males exposed to procarbazine hydrochloride. Arch Toxicol 97(8):2245–2259. 10.1007/s00204-023-03527-y - PMC - PubMed
    1. Esina E, Dodge AE, Williams A et al (2024) Power analyses to inform Duplex Sequencing study designs for MutaMouse liver and bone marrow. Environ Mol Mutagen 65(8):234–242. 10.1002/em.22619 - PubMed

LinkOut - more resources