. 2025 Jul 17;25(1):919.
doi: 10.1186/s12870-025-06963-3.

Teasing apart the sources of phylogenetic tree discordance across three genomes in the oak family (Fagaceae)

Affiliations

Teasing apart the sources of phylogenetic tree discordance across three genomes in the oak family (Fagaceae)

Zhao Shen et al. BMC Plant Biol. .

Abstract

Background: Gene tree incongruence is a well-documented, but the biological and analytical factors driving phylogenetic discordance remains incompletely understood. In this study, we investigated how different factors contribute to incongruence among gene trees in Fagaceae.

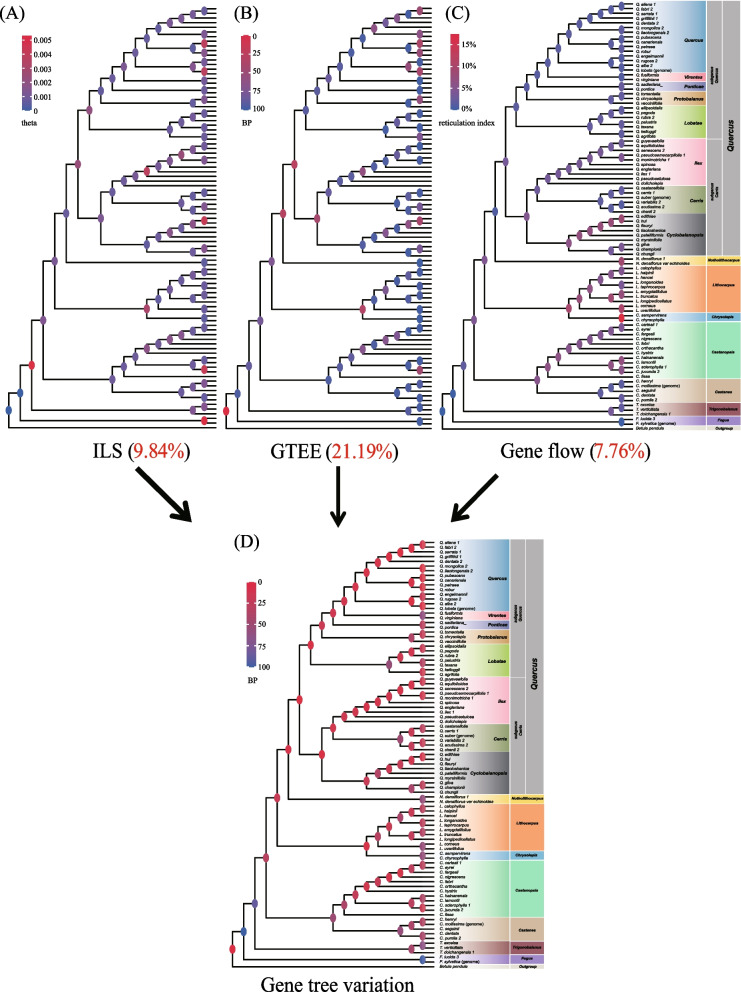
Results: Each dataset produced highly supported topologies, with Fagus and Trigonobalanus consistently placed as early-diverging lineages within the Fagaceae family. However, the cpDNA and mtDNA divided the remaining Fagaceae species into New World and Old World clades, a pattern that sharply contrasted with the phylogenetic relationships inferred from nuclear genome data. These discrepancies between the cytoplasmic and nuclear gene trees likely result from ancient interspecific hybridization within Fagaceae. The decomposition analyses revealed that gene tree estimation error, incomplete lineage sorting, and gene flow accounted for 21.19%, 9.84%, and 7.76% of gene tree variation, respectively. We further revealed that 58.1-59.5% of genes exhibited consistent phylogenetic signals ("consistent genes"), while 40.5-41.9% of genes displayed conflicting signals ("inconsistent genes"). Consistent genes showed stronger phylogenetic signals and were more likely to recover the species tree topology than inconsistent genes. However, consistent and inconsistent genes did not significantly differ in terms of sequence- and tree-based characteristics. By excluding a subset of inconsistent genes, the study significantly reduced inconsistencies between concatenation- and coalescent-based approaches.

Conclusions: This study illustrates how diverse factors contribute to gene tree incongruence, offering new insights into the evolutionary history of Fagaceae.

Keywords: Fagaceae; Gene tree discordance; Gene tree estimation error; Hybridization; Incomplete lineage sorting.


Conflict of interest statement

Declarations. Ethics approval and consent to participate: The collection of all samples fully complied with national and local legislation. In accordance with national and local laws and regulations, special permission was granted for the collection of plant samples in this study. Consent for publication: Not applicable. Competing interests: The authors declare no competing interests.

Figures

Fig. 1
Fig. 1
Conflicts between cytoplasmic (mtDNA/cpDNA, left) and nuclear (nuDNA, right) phylogenetic trees. Left panel: topology of the maximum likelihood (ML) tree inferred from mtDNA data. In the mtDNA tree, the HS clade consists of six genera divided into two major clades: NW and OW. Color (red and blue) nodes indicate consistent relationships between mtDNA and cpDNA, with phylogenetic support ≥ 95% in both ML and BI analyses on mtDNA tree (red) and support < 95% in any one of the methods (blue). Black nodes indicate inconsistent relationships between mtDNA and cpDNA. Right panel: topology of the ASTRAL-III species trees derived from nuclear genes (adapted from Zhou et al., 2022). Nodes showing consistent relationships between ASTRAL-III, SVDquartets, maximum likelihood, and MrBayes are marked in red (phylogenetic support ≥ 95% in all four analyses) or blue (support < 95% in any one of the four analyses). Nodes displaying conflicting relationships across analyses are marked with black dots. Different colors represent distinct genera and various groups of Quercus
Fig. 2
Fig. 2
Relative contributions of ILS, GTEE, and gene flow to nuclear gene tree variation across Fagaceae. A ILS. Nodes are colored according to the inferred population mutation parameter theta. B GTEE. Nodes are colored based on BP values, which represent the percentage of recovered nodes from simulations. C Gene flow. Nodes are colored according to the reticulation index. D Gene tree variation. Nodal BP values reflect the recovery of nodes in gene trees. The percentages of gene tree variation attributed to ILS, GTEE, and gene flow are indicated by red numbers
Fig. 3
Fig. 3
Dissecting incongruence between three topologies in the phylogenomic data matrix. A Schematic representation of the relationships among the genera Chrysolepis and Lithocarpus and the clade formed by the genera Quercus and Notholithocarpus (QN), as recovered by concatenation-based IQ-TREE (T1), quartet-based ASTRAL-III (T2), and SVDquartets (T3) analyses. B Distributions of ΔGLS and ΔGQS across 2124 genes in three comparisons: T1 vs. T2 (upper), T1 vs. T3 (middle), and T2 vs. T3 (lower). ΔGLS (above the y-axis) and ΔGQS (below the y-axis) values were calculated by measuring the difference in gene-wise log-likelihood scores and the difference in gene-wise quartet scores for each pair of conflicting topologies. In each comparison, red and green bars represent genes supporting the two conflicting topologies (e.g., T1 and T2), respectively. The numbers of consistent and inconsistent genes in each comparison are provided below the plot
Fig. 4
Fig. 4
Comparison of characteristics between consistent and inconsistent genes. A Differences between consistent and inconsistent genes in terms of four parameters (absolute ΔGLS, normalized absolute ΔGLS, absolute ΔGQS, and normalized absolute ΔGQS) for each pair of topologies. All four parameters significantly differed (P < 0.01, Wilcoxon-Mann Whitney U-test) between consistent and inconsistent genes. B The numbers of consistent and inconsistent genes supporting the three distinct topologies (T1, T2, and T3) under different bootstrap thresholds (i.e., 0, 10, 30, and 50). Upper panel: T1 vs. T2; middle panel: T1 vs. T3; lower panel: T2 vs. T3. The three topologies are presented in Fig. 3A
Fig. 5
Fig. 5
Phylogenetic relationships of Fagaceae species inferred using IQ-TREE based on nuclear DNA data, excluding the 208 inconsistent genes. The topology is congruent with the original maximum likelihood analysis based on the full dataset (T1 in Fig. 3A). Nodes showing consistent relationships between maximum likelihood, ASTRAL-III, and SVDquartets are marked in red (phylogenetic support ≥ 95% in all three analyses) or blue (support < 95% in any one of the three analyses). The red arrow indicates the node placing the genus Chrysolepsis as a sister group to the clade formed by the genera Notholithocarpus and Quercus. The color scheme for lineages is consistent with that used in Fig. 1

Similar articles

References

    1. Kapli P, Yang Z, Telford MJ. Phylogenetic tree building in the genomic age. Nat Rev Genet. 2020;21(7):428–44. - PubMed
    1. Jarvis ED, Mirarab S, Aberer AJ, Li B, Houde P, Li C, Ho SYW, Faircloth BC, Nabholz B, Howard JT, et al. Whole-genome analyses resolve early branches in the tree of life of modern birds. Science. 2014;346(6215):1320–31. - PMC - PubMed
    1. Stiller J, Feng SH, Chowdhury A, Rivas-González I, Duchêne DA, Fang Q, Deng Y, Kozlov A, Stamatakis A, Claramunt S, et al. Complexity of avian evolution revealed by family-level genomes. Nature. 2024;629:851–60. - PMC - PubMed
    1. Shao Y, Zhou L, Li F, Zhao L, Zhang BL, Shao F, Chen JW, Chen CY, Bi XP, Zhuang XL, et al. Phylogenomic analyses provide insights into primate evolution. Science. 2023;380(6648):913–24. - PubMed
    1. One Thousand Plant Transcriptomes I. One thousand plant transcriptomes and the phylogenomics of green plants. Nature. 2019;574(7780):679–85. - PMC - PubMed

LinkOut - more resources