

Malaria epidemics and its drivers in Uganda in 2022
- PMID: 40676649
- PMCID: PMC12273352
- DOI: 10.1186/s12936-025-05351-4
Malaria epidemics and its drivers in Uganda in 2022
Abstract
Background: In Uganda, malaria is a year-round health threat, with transmission intensity varying across regions. Despite ongoing intensified interventions, an unprecedented malaria resurgence in early 2022 affected several districts, prompting a swift response from the National Malaria Control Division (NMCD). This study aims to assess the scale and underlying causes of the epidemics, quantify the excess cases and deaths, and propose targeted prevention and response strategies.
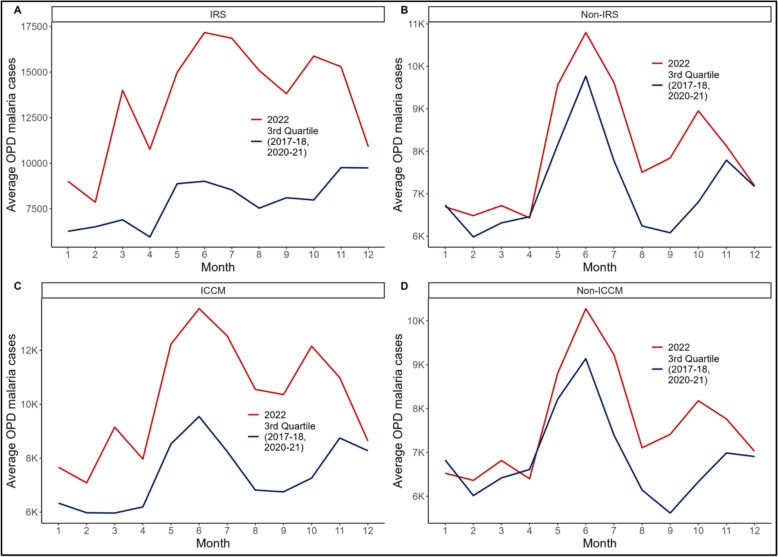
Methods: District Health Information System (DHIS2) data from 2017 to 2022 were analysed. A 75th percentile threshold from 2017 to 2021 was used to define true malaria epidemics and compare them to the suspected 2022 epidemic. Excess cases, admissions, and deaths were quantified using area under the curve (AUC) calculations. The level of epidemics was compared across districts with Indoor Residual Spraying (IRS) and Integrated Community Case Management (iCCM) interventions. Precipitation data from multiple sources were used to evaluate rainfall patterns and their impact on malaria epidemics.
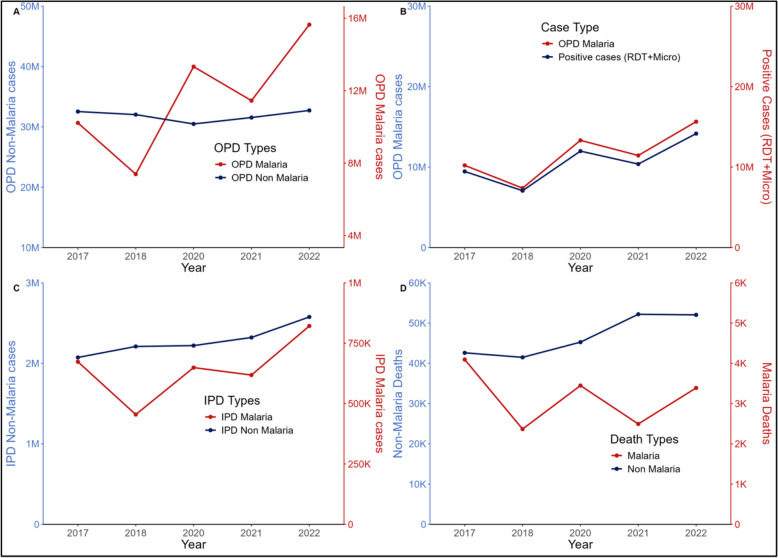
Results: Malaria cases were lowest in 2018 but rose by 31% in 2022 compared to the 2017-2021 3rd quartile. Sixty-four of 146 districts experienced epidemics, with 4 facing persistent epidemics year-round. The 2022 epidemic accounted for 3,379,309 (95% CI 1,553,714, 5,339,709) total excess outpatient malaria cases (confirmed and presumed), 3,018,920 (95% CI 1,321,951, 4,661,201) excess confirmed cases, 149,789 (95% CI 66,029, 235,743) excess inpatient cases. Paradoxically, more epidemics occurred in IRS and iCCM districts. Precipitation patterns were consistent across years and were insignificantly correlated with the 2022 epidemic. Provinces with bimodal rainfall patterns were more prone to epidemics, while unimodal regions had fewer epidemics but higher incidence rates. Rainfall lagged by two months (Lag 2) significantly increased malaria incidence (p < 0.01), with each millimetre of rainfall two months prior associated with 13.4 additional malaria cases.
Conclusion: The 2022 malaria epidemic affected 64 districts, with over 3.3 million excess cases and nearly 150,000 excess admissions. Gaps in IRS, iCCM, and intervention coverage, along with minimal rainfall correlation and high vulnerability in bimodal regions, highlight the need for better surveillance, sustainable funding, and tailored responses. While climate was not the main driver, programmatic deficiencies, vector composition shift, reduced efficacy of insecticides, coverage and effectiveness of the interventions likely fueled the epidemic. Strengthening epidemic preparedness, response, and investment will be crucial to preventing future outbreaks and achieving long-term malaria control in Uganda.
© 2025. The Author(s).
Conflict of interest statement
Declarations. Ethics approval and consent to participate: Not applicable. Consent for publication: Not applicable. Competing interests: The authors declare no competing interests.
Figures


References
-
- United Nations Population Fund. https://www.unfpa.org/data/world-populat.... Accessed 2 Oct 2024.
-
- Uganda Malaria Indicator Survey (UMIS). 2009. https://dhsprogram.com/pubs/pdf/MIS6/MIS6.pdf. Accessed 2 Oct 2024.
-
- Uganda Malaria Indicator Survey (UMIS) 2014–15. https://dhsprogram.com/pubs/pdf/mis21/mis21.pdf. Accessed 19 Nov 2024.
-
- Uganda National Household Survey 2018–2019. https://www.ubos.org/wp-content/uploads/publications/09_2021Uganda-Natio.... Accessed 19 Nov 2024.
-
- Uganda National Malaria Control Division (NMCD), Uganda Bureau of Statistics (UBOS), and ICF. 2020. Uganda Malaria Indicator Survey 2018–19. Kampala, Uganda, and Rockville, Maryland, USA: NMCD, UBOS, and ICF.
MeSH terms
Grants and funding
LinkOut - more resources
Full Text Sources
Medical
