. 2025 Jul 17;16(1):54.
doi: 10.1186/s13293-025-00737-0.

Sex-specific changes in energy demand during the preplaque stage in a transgenic Alzheimer's mouse model

Affiliations

Sex-specific changes in energy demand during the preplaque stage in a transgenic Alzheimer's mouse model

Rongwan Sun et al. Biol Sex Differ. .

Abstract

Background: Cognitive deficits and brain glucose hypometabolism, lipid peroxidation and mitochondrial dysfunction are early pathological events in murine models and patients with Alzheimer's disease (AD). Data from our previous research indicate that transgenic mice of the APP23 line, a murine AD model, exhibited higher energy expenditure and mitochondrial dysregulation in the liver as early as 3 months of age, which is considered the preplaque stage. Since women have a higher risk and mortality rate for AD, with potential sex-specific confounders as longevity, biological, genetic, and social factors also needing to be considered, sex differences in energy metabolism in AD remain insufficiently investigated.

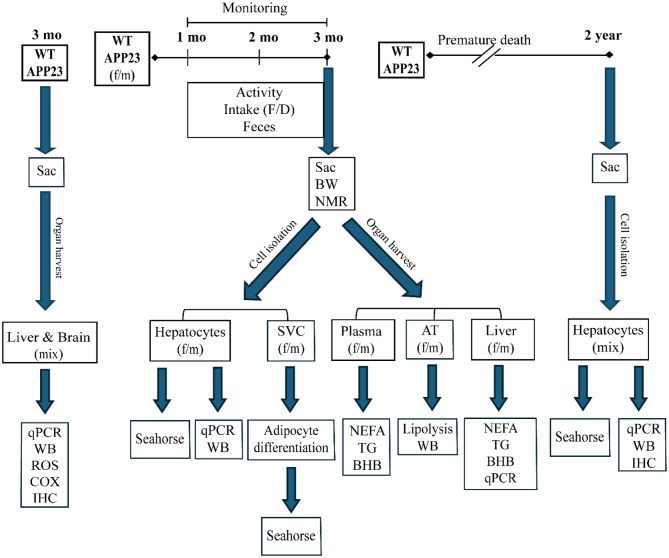
Methods: Here, we investigated sex-specific differences in mitochondrial respiration and metabolic profiles of 3-4-month-old, preplaque APP23 transgenic mice, in which we did not detect inflammatory signals and pathological amyloid-beta (Aß) plaques in brain or liver. Their mitochondrial respiration was assessed measuring oxygen consumption rates in isolated primary hepatocytes, stromal vascular cells (SVCs) and re-differentiated adipocytes. Furthermore, we analyzed energy balance, including food intake, locomotor activity, energy expenditure and fecal calorie loss.

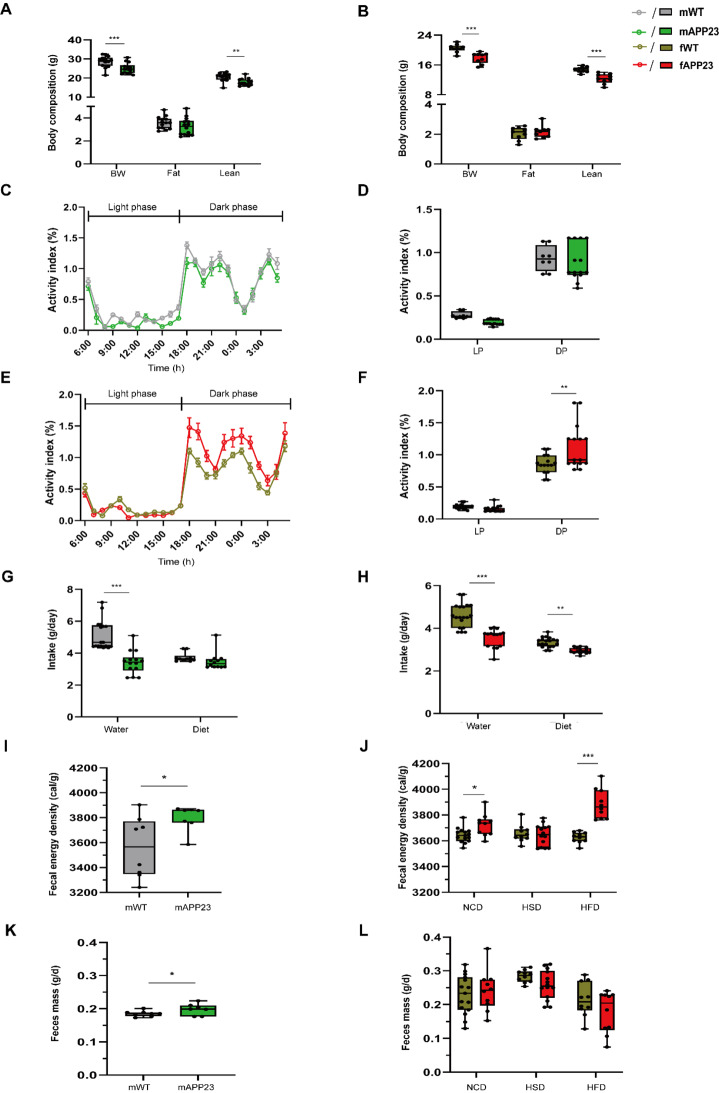
Results: We observed an upregulation of hepatic mitochondrial respiration in preplaque APP23 females. Female-derived SVCs and differentiated adipocytes improved mitochondrial flexibility with palmitate loading in vitro, which was in line with decreased plasma triglycerides in preplaque APP23 females in vivo. However, no differences in mitochondrial respiration were detected in hepatocytes and re-differentiated adipocytes derived from male APP23 mice. Furthermore, we corroborated an increased mortality during the preplaque stage, particularly in females, which exhibited reduced hyperactivity and caloric intake before death compared to survivors.

Conclusions: Our data demonstrate that preplaque APP23 female mice have disequilibrated mitochondrial oxidation in hepatocytes and adipocytes as well as higher energy expenditure due to increased activity before AD manifestation. In contrast, male APP23 mice did not exhibit such metabolic changes. Constant excessive energy loss and limited calorie supply potentially contribute to the higher risk of mortality, especially in APP23 females during young adulthood. Alzheimer's disease (AD) affects men and women differently, with women at higher risk and mortality. This study explored sex differences in energy metabolism using APP23 transgenic mice, a model of AD, at young age (3-4 months) - before pathological amyloid-beta (Aß) plaques develop in the brain and liver. Female APP23 mice showed increased mitochondrial activity in liver and fat cells, higher energy expenditure, and more movement while eating less. They also excreted more energy in their feces. Notably, female APP23 mice had a lower survival rate than males. Before death, they became less active and ate even less, suggesting an inability to maintain energy balance. These findings indicate that female APP23 mice experience excessive energy loss, which may contribute to early mortality. Understanding these sex-specific metabolic differences could provide new insights into AD progression and highlight the need for targeted treatments.


Conflict of interest statement

Declarations. Ethical approval: Animal experiments were performed in accordance with Guidance on the operation of the Animals (Scientific Procedures) Act 1986 and associated guidelines, EU Directive 2010/63 and complied with institutional ethical and ARRIVE guidelines and approved by Landesamt für Gesundheit und Soziales Berlin (T0180/16) and Forschungseinrichtung für Experimentelle Medizin Charité (T-CH19/21). Additionally, previously stored samples from an approved experiment (G0074/16) were analyzed. Consent for publication: Not applicable. Competing interests: The authors declare no competing interests.

Figures

Fig. 1
Fig. 1
Schematic overview of the experiment design. APP23: APP23 transgenic mice, AT: adipose tissue, BW: body weight, BHB: beta-hydroxybutyrate. COX: total COX enzyme activity, D: drink, ROS: Reactive oxygen species evaluation by 2′,7′-dichlorofluorescein diacetate-detection, f: female, F: food, IHC: immunohistochemistry, mo: month, m: male, mix: sex-mixed, NEFA: Non-esterified fatty acid, qPCR: quantitative RT‒PCR, Seahorse: OCR and ECAR measurements, Sac: sacrifice, SVC: stromal vascular precursor cell, TG: triglyceride, WT: wild-type mice, WB: western blots
Fig. 2
Fig. 2
Downregulation of mitochondrial respiration in liver of 1.5-year-old APP23 mice. (A-B) Oxygen consumption rate (OCR) in primary hepatocytes of old WT and APP23 mice was calculated as the percentage of the OCR of APP23 mice relative to the baseline of the WT group and is depicted as the degree of hepatic OCR progression (A) and its quantification (B). Seahorse measurements were assessed in 2 independent experiments, each with 8 technical replicates. (C) Representative western blots of key OXPHOS complexes in old hepatocytes. (D) Quantification of OXPHOS proteins relative to GAPDH in hepatocytes. (E) Expression analysis of genes involved in ER stress and antioxidant effects quantified in primary hepatocytes from old mice. The data are presented as the mean ± SEM or box plots (25th to 75th percentile) with median and whiskers from minimum to maximum and were analyzed by two-way ANOVA with Bonferroni multiple comparisons test (B, D) or independent unpaired two-tailed t test with Welch’s correction (E, per group). n = 5/4 for WT/APP23 with mixed sexes. *p ≤ 0.05, **p ≤ 0.01, ***p ≤ 0.001. AU: arbitrary units, C: complex, ER: endoplasmic reticulum, FCCP: trifluoromethoxy carbonylcyanide phenylhydrazone, OCR: oxygen consumption rate, OXPHOS: oxidative phosphorylation, R/A: rotenone + antimycin A, SC: spare capacity
Fig. 3
Fig. 3
Characterization of the Aβ preplaque stage in liver and brain young APP23 mice. (A) Expression of the human amyloid precursor protein (APP23) transgene and the endogenous mouse App gene in brain, liver and eWAT of young male and female WT and APP23 mice normalized to Rpl19 and all related to the male WT expression level in brain. The endogenous murine App transcript is detected with one mismatch (G to A) at position 5 in the fwd primer. (B-D) Expression analysis of genes involved in inflammation, mitochondrial biogenesis, fusion and fission quantified in brain of both sexes (B) as well as liver of males (C) and females (D) from WT and APP23 mice. (E) Total COX enzyme activity measured in liver and brain. (F) ROS detection in liver and brain lysates by DCFDA measurements. (G-H) IHC staining of microglia in CA1 segment of hippocampus (G) and macrophages in left liver lobe (H) by CD68+ and Aβ stained by methoxy-X04 in Aβ in representative sections of young WT and APP23 female mice (also refer to Supplementary Fig. 2). Data are presented as box plots (25th to 75th percentile) with median and whiskers from minimum to maximum and analyzed by three-way ANOVA with Bonferroni multiple comparisons test (A-B, E-F) or two-way ANOVA with Bonferroni multiple comparisons test (C-D). n = 7/6 for male/female WT and n = 4/5 for male/female APP23 for all analyses (A-H). *p ≤ 0.05, ***p ≤ 0.001. Scale bar: 50 μm, blue arrows indicate Aβ stained by methoxy-X04, red arrows CD68+ microglia/macrophages and purple arrows colocalization (G-H). Aβ: amyloid beta, AU: arbitrary units, COX: cyclooxygenase, DCFDA: 2´,7`-dichlorofluorescein diacetate, fAPP23: female APP23 transgenic mice, fWT: female WT mice, mAPP23: male APP23 transgenic mice, mWT: male WT mice, ROS: reactive oxygen and nitrogen oxide species
Fig. 4
Fig. 4
Enhanced mitochondrial respiration in primary hepatocytes of young APP23 female mice. (A-B) Hepatic OCR of young APP23 males is shown relative to the WT baseline OCRs. OCR curve (A) and its quantification (B) in primary hepatocytes from male mice. nmale = 9/8 for WT/APP23, measured in 3 independent experiments, each with 5 technical replicates. (C) Expression analysis of genes involved in ER and anti-oxidative stress response in liver of young males. nmale = 4/4 for WT/APP23. (D-E) Hepatic OCR (D) and its quantification (E) of primary hepatocytes isolated from young APP23 female mice. nfemale = 12/12 for WT/APP23, measured in 4 independent experiments, each with 5 technical replicates. (F) Expression analysis of ER and anti-oxidative stress response in primary hepatocytes from females. nfemale = 5/4 for WT/APP23. (G-H) ECAR curve (G) and its analysis (H) of these female hepatocytes; nfemale = 12/12 for WT/APP23. The data are presented as the mean ± SEM or box plots (25th to 75th percentiles) with median and whiskers from minimum to maximum and were analyzed by two-way ANOVA with Bonferroni multiple comparisons test (B, E, H) or independent unpaired two-tailed t test with Welch’s correction (F per group). *p ≤ 0.05, **p ≤ 0.01. AU: arbitrary units, ECAR: extracellular acidification rate, ER: endoplasmic reticulum, FCCP: trifluoromethoxy carbonylcyanide phenylhydrazone, GR: glycolytic reserve, OCR: oxygen consumption rate, R/A: rotenone + antimycin A, SC: spare capacity
Fig. 5
Fig. 5
Lower circulating TG, BHB and enhanced NEFA supply in young APP23 males and females. (A) Hepatic TG concentrations of young male and female mice. (B) TG concentration in plasma samples. (C) Basal NEFA secretion of primary adipocytes isolated from male and female mice. (D-E) NEFA release from primary adipocytes of young males (D) and females (E) under isoprenaline stimulation ex vivo. nmale = 5/5, nfemale = 6/6 for WT/APP23. (F-G) Quantification of ECAR of adipocytes differentiated from male (F) and female (G) mice in vitro. nmale = 9/9, nfemale = 6/6 for WT/APP23. (H-I) BHB concentration in liver (H) and plasma (I). nmale = 10/10, nfemale = 8/7 for liver, nmale = 6/5, nfemale = 7/9 for plasma. The data are presented as the mean ± SEM or box plots (25th to 75th percentiles) with median and whiskers from minimum to maximum and were analyzed by Welch and Brown-Forsythe one-way ANOVA with Dunnett’s T3 multiple comparisons test between genotypes (A-C, H-I, per group) or two-way ANOVA with Bonferroni multiple comparisons test (D-E, F-G). *p ≤ 0.05, ***p ≤ 0.001. BHB: beta-hydroxybutyrate, ECAR: extracellular acidification rate, GR: glycolytic reserve, NEFA: Non-esterified fatty acid, TG: Triglyceride
Fig. 6
Fig. 6
Increased mitochondrial flexibility in SVCs and differentiated adipocytes from APP23 females during fatty acid stress. (A-D, F-G) OCR curves (A, C, F) and calculations (B, D, G) of cultured SVCs (A-B) and differentiated adipocytes (C-D, F-G) derived from eWAT of young females and calculated as a percentage vs. WT. Comparative OCR analysis of SVCs (A-B, nfemale = 6/5) and in vitro differentiated adipocytes (C-D, F-G, nfemale = 6/6) under control conditions (BSA-NaCl, C-D) or fatty acid stimulation (PA, 100 µM BSA-palmitate, F-G). 3 independent experiments, each with 5 technical replicates. (E) Representative western blots of key OXPHOS complexes and corresponding quantification in eWAT of females normalized to GAPDH loading, nfemale = 5/5. The data are presented as the mean ± SEM or box plots (25th to 75th percentiles) with median and whiskers from minimum to maximum and were analyzed by two-way ANOVA with Bonferroni multiple comparisons (B, D, G). *p ≤ 0.05, **p ≤ 0.01, eWAT: epigonadal white adipose tissue, FCCP: trifluoromethoxy carbonylcyanide phenylhydrazone, PA: BSA-palmitate, R/A: rotenone + antimycin A, SC: spare capacity, SVC: stromal vascular cells
Fig. 7
Fig. 7
Reduced lean mass and decreased feeding with increased activity and energy loss in young APP23. (A-B) Body weight (BW), fat and lean mass of male (A) and female (B) mice. nmale = 14/14 and nfemale = 9/9 for WT/APP23. (C-F) Activity profiles of male (C-D) and female (E-F) mice monitored in the DVC system as daily averages per hour (C, E) and as the means during the light (LP) and dark phases (DP) (D, F). nmale = 8/14 and nfemale = 15/15. (G-H) Mean daily water and diet intake of males (G) and females (H). nmale = 17/14 and nfemale = 19/15. (I-L) Mean fecal energy density (I-J) and daily feces mass (K-L) of 20-week-old males fed a 20 weeks ND (I, K) and 26-week-old females (J, L) fed 20 weeks normal-control (NCD), high-sucrose (HSD) or high-fat diet (HFD) over 48 h collection time. nmale = 8/7 and nfemale = 15/10 (NCD), 10/14 (HSD), 10/10 (HFD). The data are presented as the mean ± SEM or box plots (25th to 75th percentiles) with median and whiskers from minimum to maximum and were analyzed by two-way ANOVA with Bonferroni multiple comparisons test (A-B, D, F, G-H, J, L) or unpaired two-tailed t test with Welch’s correction (I, K). *p ≤ 0.05, **p ≤ 0.01, ***p ≤ 0.001, BW: body weight, DP: dark phase, LP: light phase, NCD: normal-control diet, HFD: high-fat diet, HSD: high-sucrose diet
Fig. 8
Fig. 8
Dying APP23 females exhibit reduced activity and further decreased diet intake before death. (A) Sex- and genotype-specific survival rates of WT and APP23 mice. (B, G) Changes in the diet intake of APP23 males (B) and females (G) 10 days before death. (C-F) 24 h activity of APP23 males (C, D) and females (E, F). (H) Drink intake of APP23 females. Number of surviving/dying mice: nfemale = 8/11 and nmale = 11/6 for activity, nfemale = 7/10 and nmale = 9/5 for diet, nfemale = 7/10 for drink. The data are presented as Kaplan‒Meier curves, mean ± SEM or box plots (25th to 75th percentiles) with median and whiskers from minimum to maximum and were analyzed by log-rank tests (A) and unpaired two-tailed t tests with Welch’s correction (B, D, F-H). *p ≤ 0.05, **p ≤ 0.01, ***p ≤ 0.001

Similar articles

References

    1. Knopman DS, Amieva H, Petersen RC, Chételat G, Holtzman DM, Hyman BT, et al. Alzheimer disease. Nat Reviews Disease Primers. 2021;7(1):33. - PMC - PubMed
    1. Zhao X, Li C, Ding G, Heng Y, Li A, Wang W, et al. The burden of alzheimer’s disease mortality in the united states, 1999–2018. J Alzheimers Dis. 2021;82(2):803–13. - PubMed
    1. 2020 Alzheimer’s disease facts and figures. Alzheimers Dement. 2020. - PubMed
    1. Guo L, Zhong MB, Zhang L, Zhang B, Cai D. Sex differences in alzheimer’s disease: insights from the multiomics landscape. Biol Psychiatry. 2022;91(1):61–71. - PMC - PubMed
    1. Zarulli V, Barthold Jones JA, Oksuzyan A, Lindahl-Jacobsen R, Christensen K, Vaupel JW. Women live longer than men even during severe famines and epidemics. Proc Natl Acad Sci U S A. 2018;115(4):E832–40. - PMC - PubMed