. 2025 Jul;62(2):e70202.
doi: 10.1111/ejn.70202.

GSK-3β and mTOR Phosphorylation Mediate the Reversible Regulation of Hypomagnetic Field on Adult Neural Stem Cell Proliferation

Affiliations

GSK-3β and mTOR Phosphorylation Mediate the Reversible Regulation of Hypomagnetic Field on Adult Neural Stem Cell Proliferation

Jie Ren et al. Eur J Neurosci. 2025 Jul.

Abstract

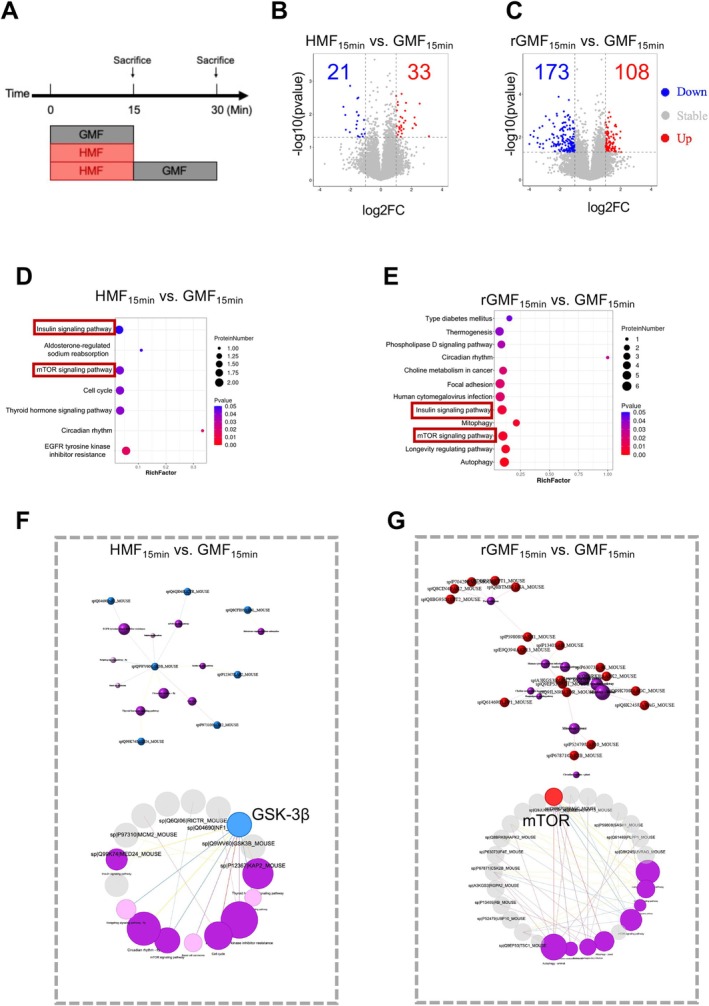
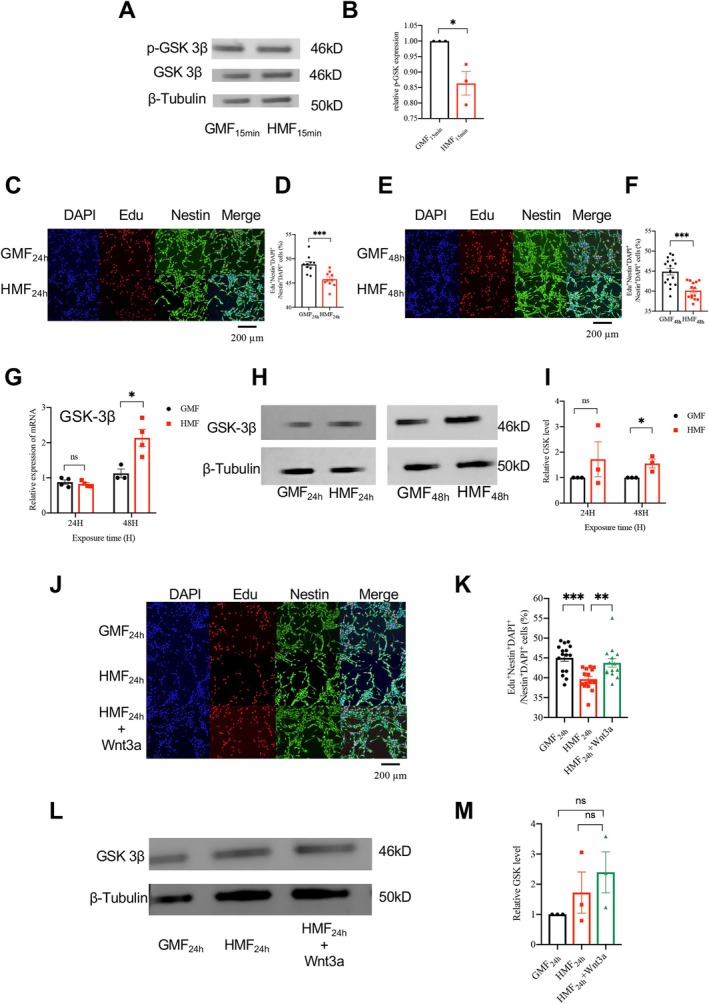
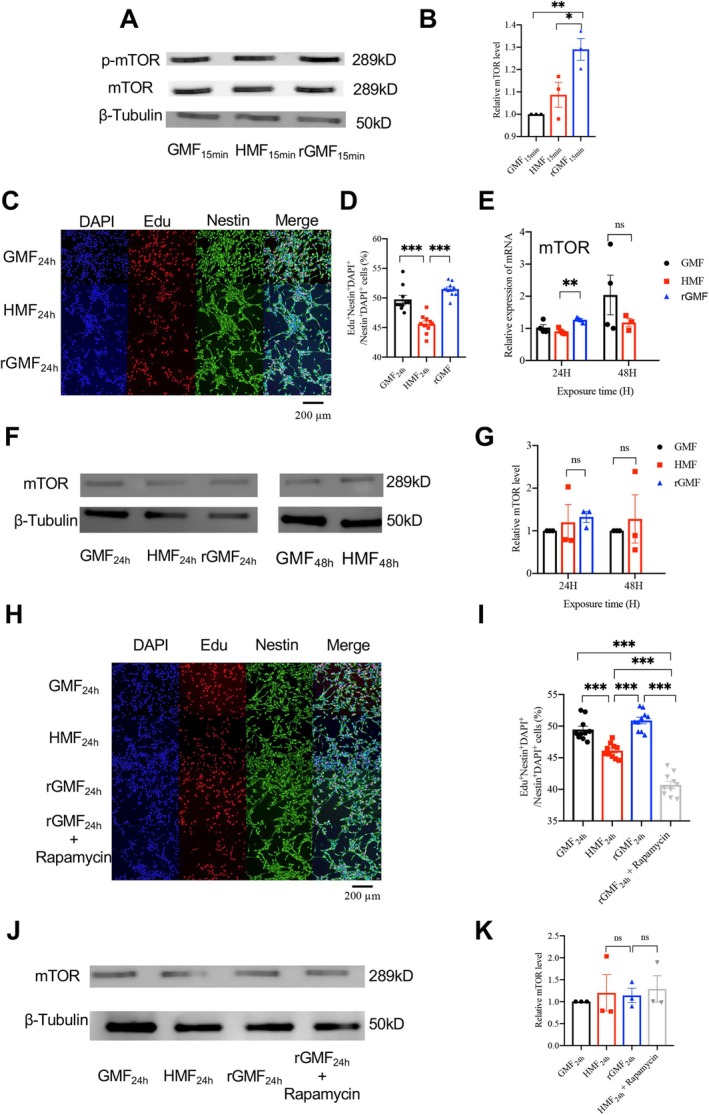
Exposure to hypomagnetic field (HMF) of < 5 μT has been demonstrated to impair cognitive behaviors in mammals by disrupting neurogenesis. This process could potentially be modulated by the protein phosphorylation of adult neural stem cells (aNSCs) that are highly sensitive to environmental changes. However, the effects of HMF on aNSCs protein phosphorylation remain unclear. Here, we found that HMF reversibly regulates the effects on aNSC proliferation by modulating protein phosphorylation in aNSCs. Specifically, HMF inhibits aNSCs proliferation by reducing glycogen synthase kinase 3β (GSK-3β) phosphorylation, and when aNSCs are returned from HMF to the geomagnetic field (rGMF), rGMF activates mammalian target of rapamycin (mTOR) phosphorylation to restore their proliferation. These findings not only advance our understanding of the molecular basis of HMF-induced biological effects but also illuminate potential therapeutic targets for maintaining neural homeostasis in extreme environments.

Keywords: GSK‐3β; adult neural stem cells; hypomagnetic field; mTOR; protein phosphorylation.


Conflict of interest statement

The authors declare no conflicts of interest.

Figures

FIGURE 1
FIGURE 1
Analysis of the number of differentially phosphorylated peptides. (A) Experimental timeline for DIA phosphoproteomics of aNSCs during GMF, HMF, or rGMF exposure. (B, C) Volcano plots. The red dot indicates significantly upregulated, the green dot indicates significantly downregulated, and the gray dot indicates nonsignificant change. (D, E) Significantly enriched pathway. This figure shows the metabolic pathway in which the differentially expressed proteins are significantly enriched. The X axis is the enrichment factor (RichFactor), which represents the number of differential proteins annotated to the pathway divided by all the proteins identified in the pathway. Larger values indicate the greater proportions of differential proteins annotated to the pathway. The size of the circle represents the number of differential proteins annotated to the pathway. (F, G) Pathway relationship networks. Red dots represent upregulated proteins, and the blue dots represent the downregulated proteins. The purple circles represent the top 10 enriched pathways, darker purple indicates significant enrichment, lighter purple indicates insignificant enrichment, and a larger area indicates a higher level of enrichment.
FIGURE 2
FIGURE 2
HMF reduces GSK‐3β phosphorylation and inhibits aNSC proliferation. (A) Western blot analysis of GSK‐3β phosphorylation levels in aNSCs after 15 min exposure to GMF and HMF. (B) Quantification of GSK‐3β phosphorylation levels in aNSCs after 15‐min exposure to GMF and HMF. (C) Representative images of aNSC proliferation after 24‐h exposure to GMF and HMF. Scale bar = 200 μm. (D) Percentage of Edu+ aNSCs in total aNSCs after 24 h of exposure to HMF and GMF. (E) Representative images of aNSC proliferation after 48 h of exposure to GMF and HMF. Scale bar = 200 μm. (F) Percentage of Edu+ aNSCs out of total aNSCs after 48‐h exposure to HMF and GMF. (G) Relative GSK‐3β mRNA expression levels in aNSCs after 24 and 48 h of HMF and GMF exposure. (H) Western blot analysis of relative GSK‐3β expression levels in aNSCs after 24 and 48 h of HMF and GMF exposure. (I) Quantification of relative GSK‐3β expression levels in aNSCs after 24 and 48 h of HMF and GMF exposure. (J) Representative images of aNSC proliferation after 24‐h exposure to GMF, HMF and HMF + Wnt3a. Scale bar = 200 μm. (K) Percentage of Edu+ aNSCs in total aNSCs after 24‐h exposure to GMF, HMF, and HMF + Wnt3a. (L) Western blot analysis of relative GSK‐3β expression levels in aNSCs after 24 h of exposure to HMF, GMF, and HMF + Wnt3a. (M) Quantification of relative GSK‐3β expression levels in aNSCs after 24 and 48 h of exposure to HMF, GMF, and HMF + Wnt3a. n = 3. Data are presented as the mean ± SEM; *p < 0.05, **p < 0.05, and ***p < 0.001.
FIGURE 3
FIGURE 3
rGMF increases mTOR phosphorylation and restores aNSC proliferation. (A) Western blot analysis of mTOR phosphorylation levels in aNSCs after 15‐min exposure to GMF, HMF, and rGMF. (B) Quantification of mTOR phosphorylation levels in aNSCs after 15‐min exposure to GMF, HMF, and rGMF. (C) Representative images of aNSC proliferation after 24‐h exposure to GMF, HMF, and rGMF. Scale bar = 200 μm. (D) Percentage of Edu+ aNSCs in total aNSCs after 24 h of exposure to GMF, HMF, and rGMF. (E) Relative mTOR mRNA expression levels in aNSCs after 24 and 48 h of exposure to GMF, HMF, and rGMF. (F) Western blot analysis of relative mTOR expression levels in aNSCs after 24 and 48 h of exposure to HMF and GMF. (G) Quantification of relative mTOR expression levels in aNSCs after 24 and 48 h of HMF and GMF exposure. (H) Representative images of aNSC proliferation after 24‐h exposure to GMF, HMF, rGMF, and rGMF + Rapamycin. Scale bar = 200 μm. (I) Percentage of Edu+ aNSCs in total aNSCs after 24 h of exposure to GMF, HMF, rGMF, and rGMF + Rapamycin. (J) Western blot analysis of mTOR phosphorylation levels in aNSCs after 15‐min exposure to GMF, HMF, rGMF, and rGMF + Rapamycin. (K) Quantification of relative mTOR expression levels in aNSCs after 24 and 48 h of exposure to GMF, HMF, rGMF, and rGMF + Rapamycin. n = 3. Data are presented as the mean ± SEM; *p < 0.05, **p < 0.01, and ***p < 0.001.

Similar articles

References

    1. Afshinnekoo, E. , Scott R. T., MacKay M. J., et al. 2020. “Fundamental Biological Features of Spaceflight: Advancing the Field to Enable Deep‐Space Exploration.” Cell 183: 1162–1184. 10.1016/j.cell.2020.10.050. - DOI - PMC - PubMed
    1. Chung, J. , Kuo C. J., Crabtree G. R., and Blenis J.. 1992. “Rapamycin‐FKBP Specifically Blocks Growth‐Dependent Activation of and Signaling by the 70 kd S6 Protein Kinases.” Cell 69: 1227–1236. 10.1016/0092-8674(92)90643-q. - DOI - PubMed
    1. Dale, T. C. 1998. “Signal Transduction by the Wnt Family of Ligands.” Biochemical Journal 329, no. Pt 2: 209–223. 10.1042/bj3290209. - DOI - PMC - PubMed
    1. Gianferrara, T. , Cescon E., Grieco I., Spalluto G., and Federico S.. 2022. “Glycogen Synthase Kinase 3β Involvement in Neuroinflammation and Neurodegenerative Diseases.” Current Medicinal Chemistry 29: 4631–4697. 10.2174/0929867329666220216113517. - DOI - PubMed
    1. Gonçalves, J. T. , Schafer S. T., and Gage F. H.. 2016. “Adult Neurogenesis in the Hippocampus: From Stem Cells to Behavior.” Cell 167: 897–914. 10.1016/j.cell.2016.10.021. - DOI - PubMed

MeSH terms

Substances

LinkOut - more resources