. 2025 Jun 27:33:102031.
doi: 10.1016/j.mtbio.2025.102031. eCollection 2025 Aug.

An integrin-based quercetin 7-rhamnoside liver-targeted delivery liposomes for intrahepatic cholestasis in pregnancy

Affiliations

An integrin-based quercetin 7-rhamnoside liver-targeted delivery liposomes for intrahepatic cholestasis in pregnancy

Xiaoying Feng et al. Mater Today Bio. .

Abstract

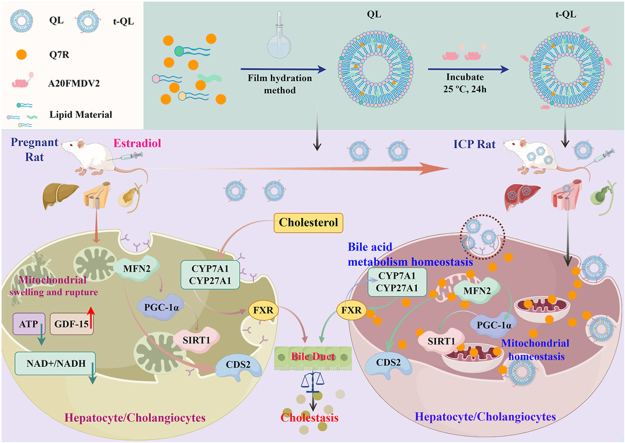
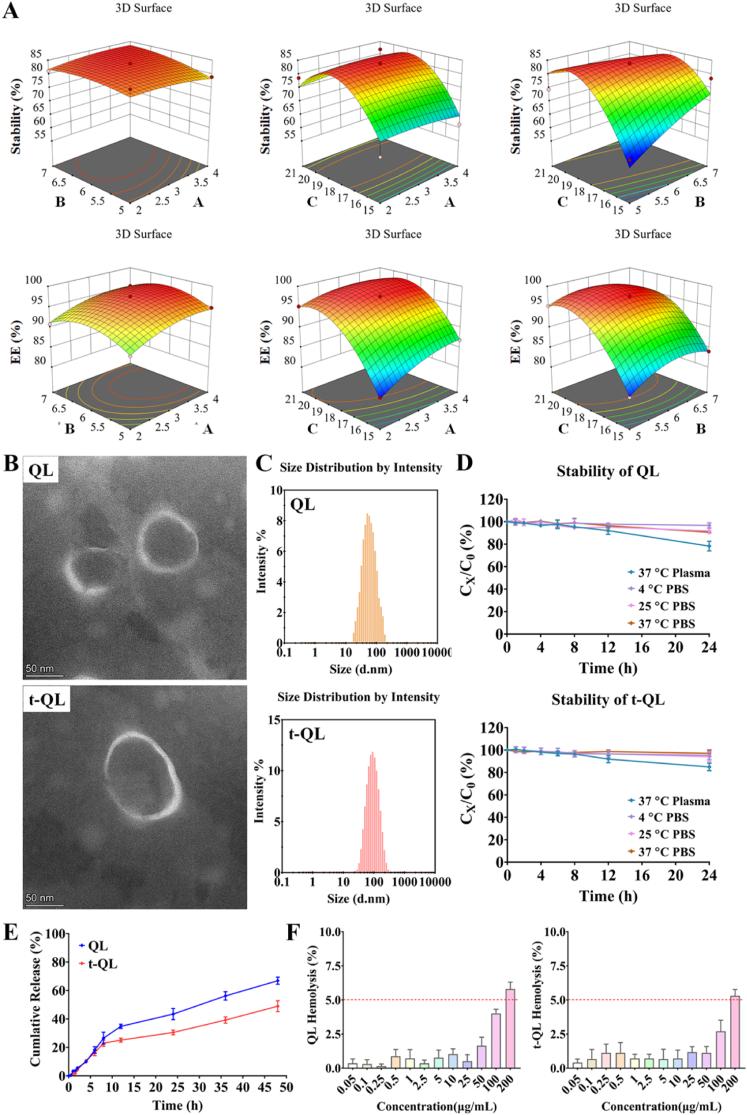
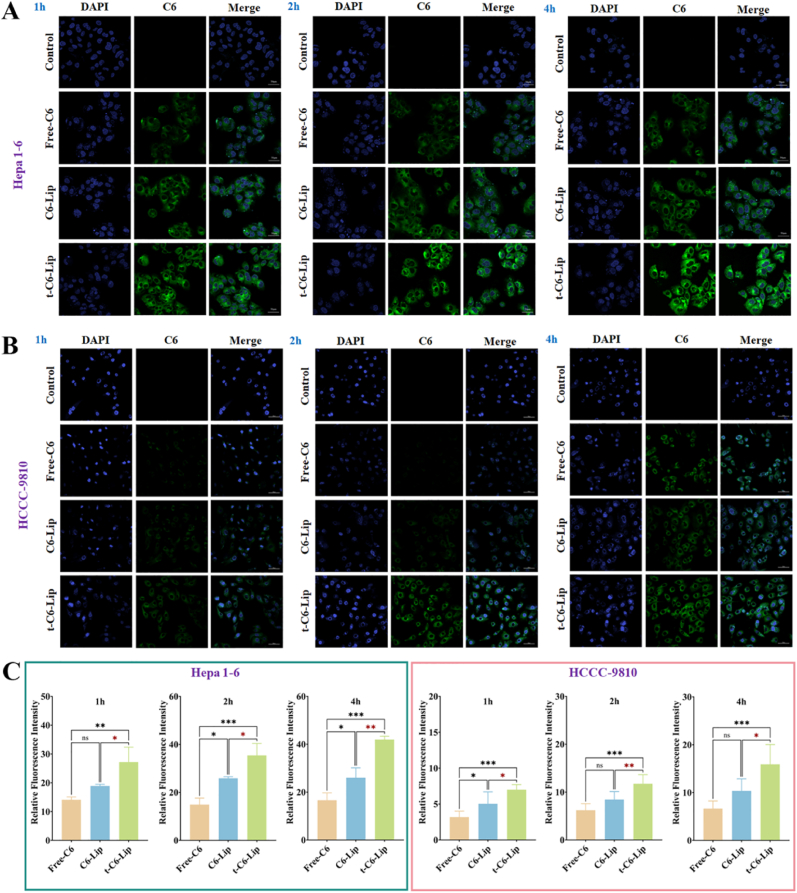
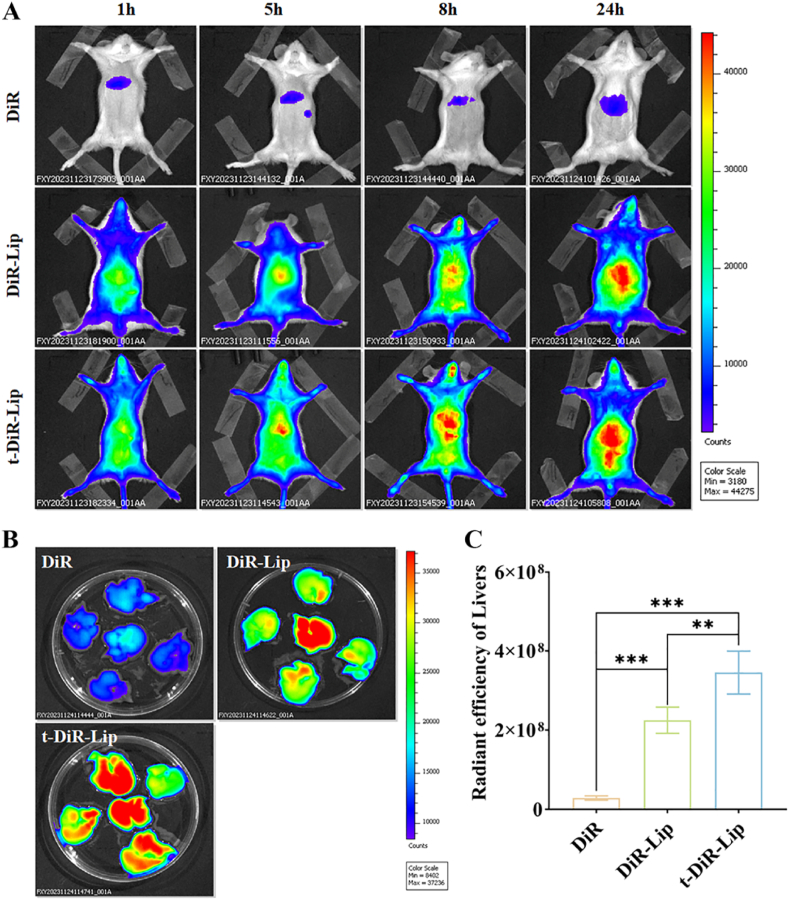
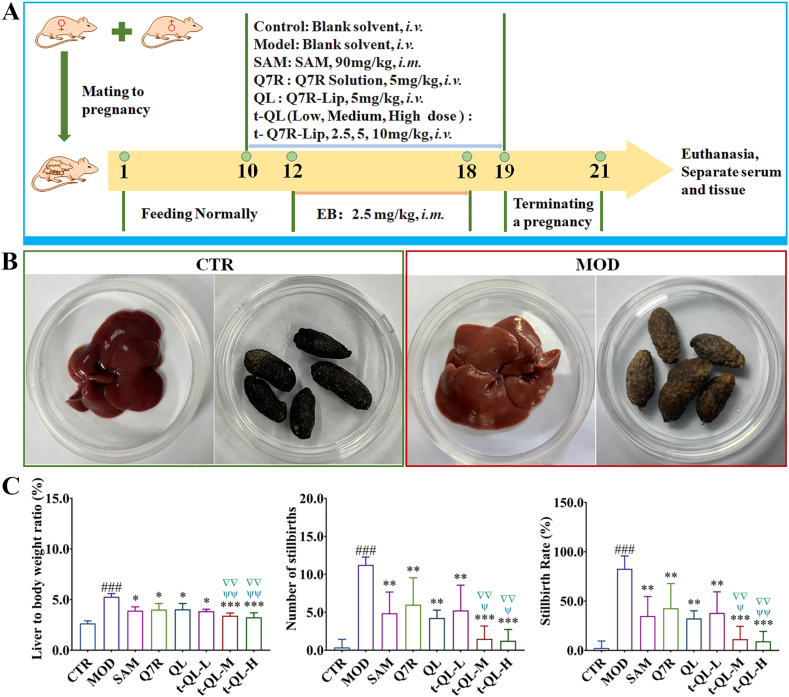
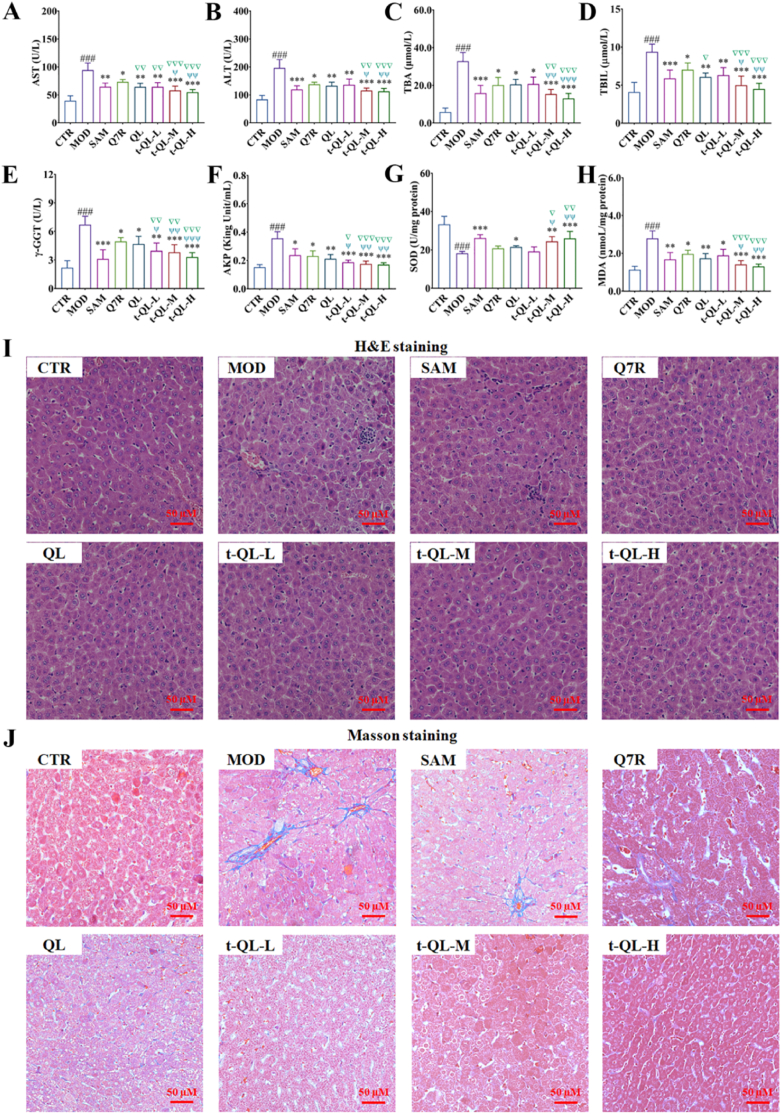
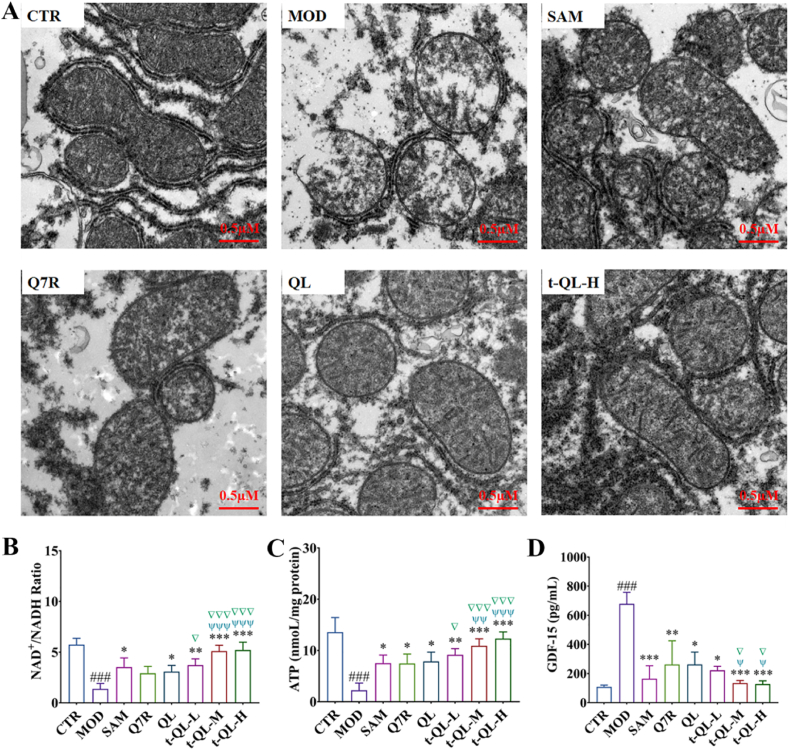
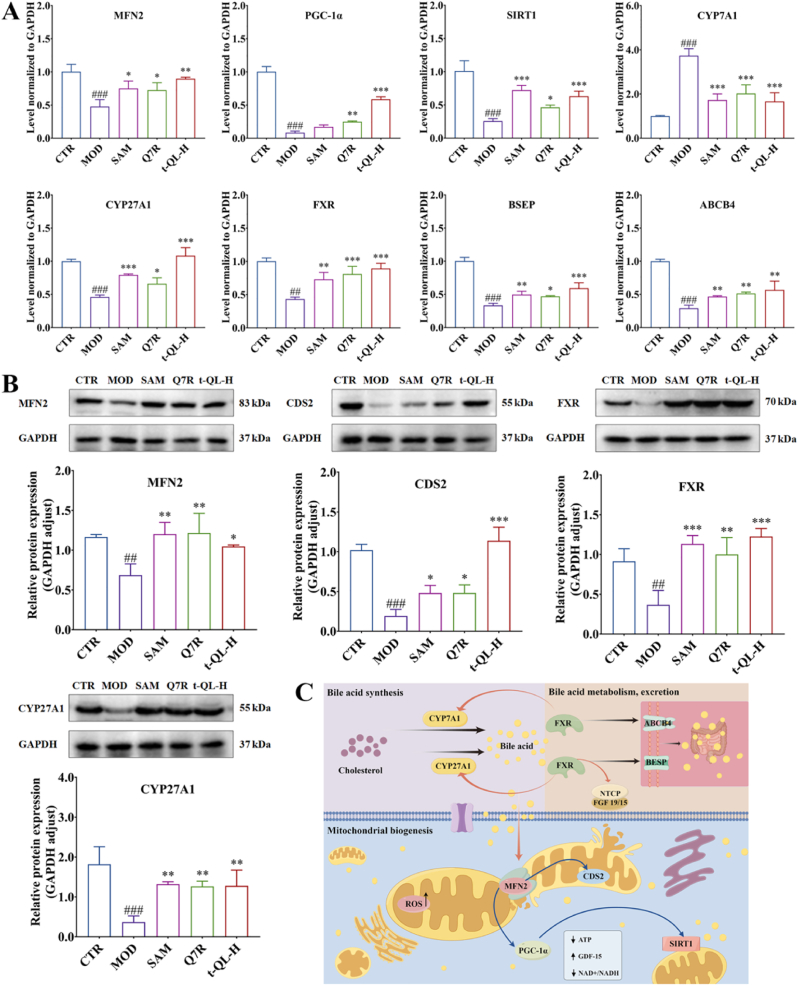
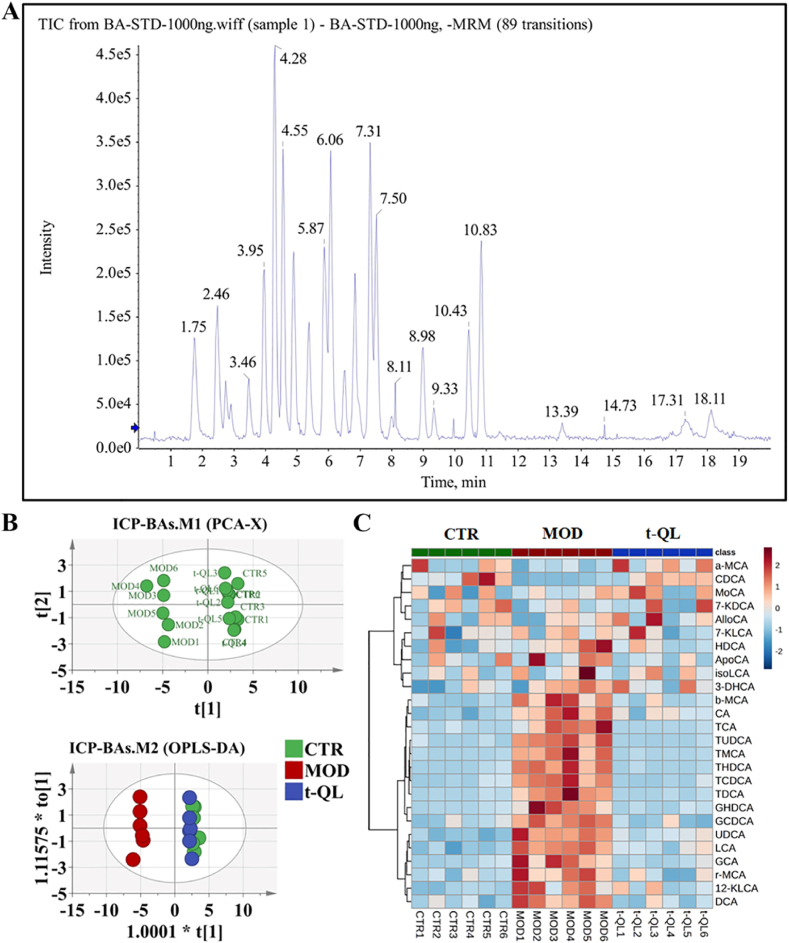
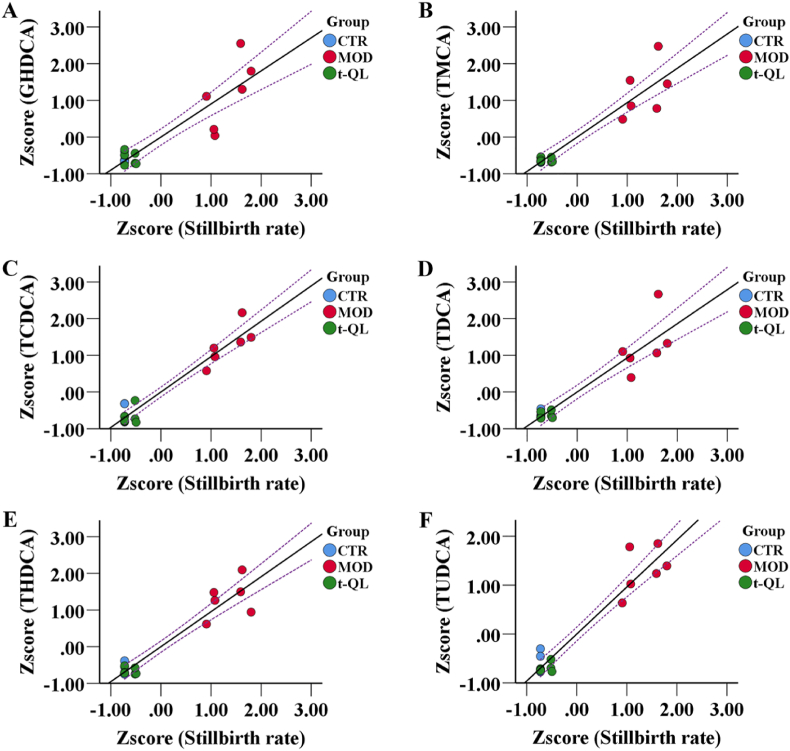
Intrahepatic cholestasis in pregnancy (ICP) is a characteristic disease during the perinatal period; however, its therapy remains unsatisfactory, and the pathogenesis remains unclear. The ameliorative effect of naturally occurring quercetin 7-rhamnoside (Q7R) in cholestasis has been established. In this study, we aimed to establish a nanoparticle-based peptide, A20FMDV2-modified liposome (t-QL), to encapsulate and deliver Q7R. Q7R bioavailability improved significantly when liposomes were used as carriers. This peptide A20FMDV2-modified nanosystem targeted integrin αvβ6 on biliary epithelial cells and improved stillbirth rates and liver function indicators better than free Q7R without a carrier. Q7R improved ICP by regulating mitochondrial function and bile metabolism. Our nanosystem provides a promising nanotherapeutic strategy for applying Q7R in ICP. We also elucidated a therapeutic mechanism underlying the action of ICP by simultaneously targeting mitochondrial structure and function, as well as bile acid metabolism.

Keywords: Bile acid metabolism; Intrahepatic cholestasis in pregnancy; Mitochondrial function; Nanodrug delivery system; Peptide A20FMDV2; Quercetin 7-rhamnoside.


Conflict of interest statement

The authors declare that they have no known competing financial interests or personal relationships that could have appeared to influence the work reported in this paper.

Figures

Image 1
Graphical abstract
Fig. 1
Fig. 1
Preparation and characterization of t-QL. (A) Response surface plots (three-dimensional) showing the effect of the SPC:HSPC (X1; w/w), TPC:SCS (X2; w/w), and TPC:Q7R (X3, % w/w) on the Stability (%) and EE (%) in the QL; (B) Representative transmission electron microscopy (TEM) images of QL and t-QL; scale bar = 50 nm; (C) Particle sizes of QL and t-QL; (D) Stability of QL and t-QL; (E) Drug release profiles of QL and t-QL in PBS; (F) Safety evaluation about haemolysis.
Fig. 2
Fig. 2
Evaluation of hepatocyte and biliary epithelial cells targeting characteristics in vitro. (A) LSCM fluorescence images of Heap1-6 cell line after incubation with Free-C6, C6-Lip, and t-C6-Lip for 1, 2, and 4 h; (B) LSCM fluorescence images of HCCC-9810 cell line after incubation with Free-C6, C6-Lip, and t-C6-Lip for 1, 2, and 4 h; (C) Semi-quantitative fluorescence intensity analysis of the Heap1-6 and HCCC-9810 cell line uptake of Free-C6, C6-Lip, and t-C6-Lip for 1, 2, and 4 h (n = 3); ∗, p < 0.05; ∗∗, p < 0.01; and ∗∗∗, p < 0.001 compared to the Free-C6 group.
Fig. 3
Fig. 3
Targeting and the biodistribution of C6- t-QL in a mouse. (A) Distribution of Free-DiR, DiR-Lip, and t-DiR-Lip at 6, 12, and 24 h in mice; (B) Fluorescence images after administration of Free-DiR, DiR-Lip, and t-DiR-Lip in different tissues in mice; (C) Semi-quantitative fluorescence intensity analysis of the liver uptake of Free-DiR, DiR-Lip, and t-DiR-Lip (n = 3); ∗, p < 0.05; ∗∗, p < 0.01; and ∗∗∗, p < 0.001 compared to the DiR group.
Fig. 4
Fig. 4
Establishment of an ICP rat model induced by EB (n = 8). (A) Schematic diagram of the experimental design and t-QL for treatment of ICP; (B) Representative image of livers and feces; (C) Liver index, number of stillbirths and stillbirth rate of ICP rat; ∗, p < 0.05; ∗∗, p < 0.01; and ∗∗∗, p < 0.001 compared to the model group. #, p<0.05; ##, p<0.01;###, p<0.001 compared to the control; ▽, p < 0.05; ▽▽, p < 0.01; and ▽▽▽, p < 0.001 compared to the Q7R; ψ, p < 0.05; ψψ, p < 0.01; and ψψψ, p < 0.001 compared to the QL.
Fig. 5
Fig. 5
Effect of t-QL treatment on ICP. (A–H) Serum ALT, AST, and ALP levels of ICP rat after treatment with different concentrations of t-QL (n = 8); ∗, p < 0.05; ∗∗, p < 0.01; and ∗∗∗, p < 0.001 compared to the model group. #, p<0.05; ##, p<0.01;###, p<0.001 compared to the control; ▽, p < 0.05; ▽▽, p < 0.01; and ▽▽▽, p < 0.001 compared to the Q7R; ψ, p < 0.05; ψψ, p < 0.01; and ψψψ, p < 0.001 compared to the QL; (I) Representative images of H&E stained liver tissue of ICP rat after treatment with different concentrations of t-QL, scalebar = 50 μm; (J) Representative images of Masson-stained liver tissue of ICP rat after treatment with different concentrations of t-QL, scalebar = 50 μm.
Fig. 6
Fig. 6
Effect of t-QL on mitochondrial structure and function of ICP rat. (A) TEM images of hepatocyte mitochondrial, scalebar = 0.5 μm; (B) Liver NAD+/NADH ratio; (C) ATP levels and (D) GDF-15 levels in CTR and ICP rat were measured after treatment (n = 8). ∗, p < 0.05; ∗∗, p < 0.01; and ∗∗∗, p < 0.001 compared to the model group; #p<0.05;###, p<0.001 compared to the control; ▽, p < 0.05; ▽▽▽, p < 0.001 compared to the Q7R; ψ, p < 0.05; ψψ, p < 0.01; ψψψ, p < 0.001 compared to the QL.
Fig. 7
Fig. 7
Effects of t-QL on mRNA and protein expression in the liver of ICP rat. (A) Analysis of mRNA level are related to bile acid metabolism and mitochondria metabolism in the liver; (B) Analysis of proteins are related to bile acid metabolism and mitochondria metabolism in the liver, (n = 3), ∗, p < 0.05; ∗∗, p < 0.01; and ∗∗∗, p < 0.001 compared to the model group; #p<0.05;###, p<0.001 compared to the controlgroup; (C) The brief diagram of bile acid metabolism and mitochondria metabolism pathway.
Fig. 8
Fig. 8
Effect of t-QL on bile acid metabolism in ICP rat (n = 6). (A) Representative UPLC-MS/MS chromatogram of bile acid detection; (B) PCA-X and OPLS-DA score plot of ICP model rat; (C) Heatmap analysis of ICP model rat.
Fig. 9
Fig. 9
Bile acid metabolite correlations with stillbirth rate scores (n = 6). Scatter plot correlations between (A) serum GHDCA and stillbirth rate scores; (B) serumTMCA and stillbirth rate scores; (C) serum TCDCA and stillbirth rate scores; (D) serum TDCA and stillbirth rate scores; (E) serum THDCA and stillbirth rate scores; (F) serum TUDCA and stillbirth rate scores; dashed lines indicate the mean value confidence interval for the line of best fit.

Similar articles

References

    1. Zhang P., Tan Z., Li C., Han Z., Zhou J., Yin Y. The correlation between serum total bile acid and adverse perinatal outcomes in pregnant women with intrahepatic cholestasis of pregnancy (ICP) and non-ICP hypercholanemia of pregnancy. Ann. Med. 2024;56 - PMC - PubMed
    1. Liu Y., Wei Y., Chen X., Huang S., Gu Y., Yang Z., et al. Genetic study of intrahepatic cholestasis of pregnancy in Chinese women unveils East Asian etiology linked to historic HBV epidemic. J. Hepatol. 2025;82:826–835. - PubMed
    1. Rizzolo D., Kong B., Taylor R.E., Brinker A., Goedken M., Buckley B., et al. Bile acid homeostasis in female mice deficient in Cyp7a1 and Cyp27a1. Acta Pharm. Sin. B. 2021;11:3847–3856. - PMC - PubMed
    1. Tang M., Xiong L., Cai J., Gong X., Fan L., Zhou X., et al. Comprehensive analysis of scRNA-Seq and bulk RNA-Seq reveals transcriptional signatures of macrophages in intrahepatic cholestasis of pregnancy. J. Inflamm. Res. 2024;17:6863–6874. - PMC - PubMed
    1. Li J., Chen J., Lee P.M.Y., Zhang J., Li F., Ren T. Familial clustering of intrahepatic cholestasis of pregnancy: a nationwide population-based study in Denmark. Hepatology. 2023;78:389–396. Baltimore, Md. - PubMed

LinkOut - more resources