. 2025 Jul 3:16:1618342.
doi: 10.3389/fimmu.2025.1618342. eCollection 2025.

TREM1 is essential for maintaining stemness of liver cancer stem-like cells in hepatocellular carcinoma

Affiliations

TREM1 is essential for maintaining stemness of liver cancer stem-like cells in hepatocellular carcinoma

Arsha Sreekumar et al. Front Immunol. .

Abstract

Introduction: Hepatocellular carcinoma (HCC) is the most common primary liver cancer and a leading cause of cancer-related mortality worldwide. While the Triggering Receptor Expressed on Myeloid Cells 1 (TREM1) is well-known for its role in amplifying inflammation within the tumor microenvironment (TME), its tumor-intrinsic role remains poorly defined. Liver cancer stem-like cells (LCSLCs), charecerized by expression of CD133 and EpCAM, are critical for HCC initiation, metastasis, recurrence, and therapy resistance.

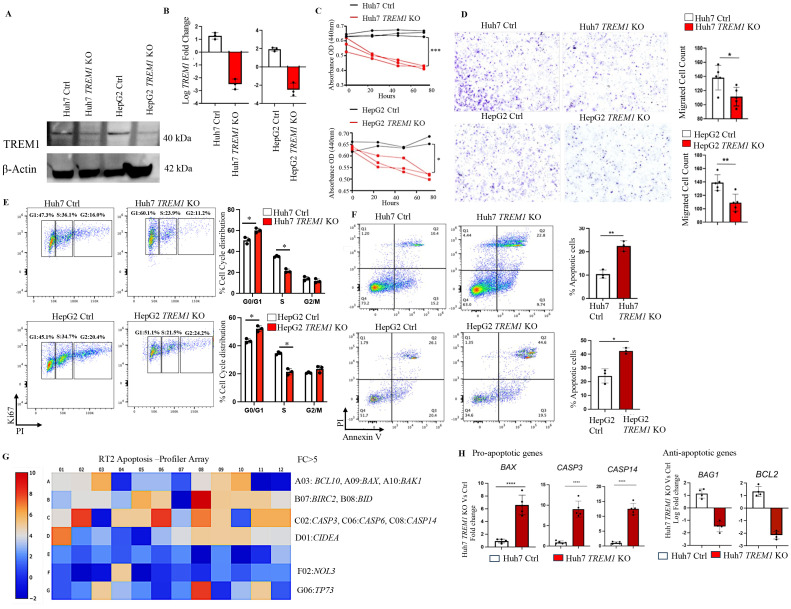
Methods: We used flow cytometry to assess TREM1 expression in LCSLCs and employed CRISPR-Cas9 gene editing to knock out TREM1 in HCC cell lines. Functional assays, including proliferation, migration, apoptosis, clonogenicity, and spheroid formation, were performed. Cell line-derived xenograft (CDX) models were used to evaluate in vivo tumorigenicity. Transcriptomic profiling was conducted to explore downstream effects of TREM1 deletion. Additionally, a pharmacological inhibitor of TREM1 (VJDT) was used to validate the therapeutic potential of targeting TREM1 in vivo.

Results: TREM1 was highly expressed in CD133+EpCAM+ LCSLCs. Knockout of TREM1 significantly impaired proliferation and migration while promoting apoptosis in HCC cells. In LCSLCs, TREM1 silencing reduced clonogenic ability and spheroid formation, indicating loss of self-renewal and stemness. In CDX models, TREM1-deficient LCSLCs exhibited markedly reduced tumorigenicity. Transcriptomic analysis revealed distinct, context-dependent gene expression changes in nuclear and extracellular signaling pathways following TREM1 loss. Pharmacologic inhibition of TREM1 with VJDT recapitulated the tumor-suppressive effects observed in genetic models.

Discussion: Our findings establish TREM1 as a critical tumor-intrinsic regulator of LCSLC survival and tumorigenic potential, independent of its known immunomodulatory role in the TME. Targeting TREM1 may therefore represent a promising dual-action therapeutic strategy to disrupt both cancer stem-like cell function and the pro-inflammatory tumor milieu in HCC.

Keywords: TREM1; cancer stem cells; chemotherapy; hepatocellular carcinoma; oncogenesis.


Conflict of interest statement

AA and AH are inventors on a patent application (US patent no.US21/51072) submitted by Augusta University that covers compositions and methods for inhibiting TREM1. The remaining authors declare that the research was conducted in the absence of any commercial or financial relationships that could be construed as a potential conflict of interest. The author(s) declared that they were an editorial board member of Frontiers, at the time of submission. This had no impact on the peer review process and the final decision.

Figures

Figure 1
Figure 1
TREM1 is actively expressed in liver hepatocellular carcinoma. (A) Box plot shows higher TREM1 expression in iCluster1 and iCluster3 compared to iCluster2 and normal tissue (plotted using Graphpad Prism 9). (B) Kaplan-Meier survival curve shows significant correlation between TREM1 expression and worse overall survival in iCluster1 and 3 cohorts. (C) Violin plot shows correlation between TREM1 expression and tumor stages. Stage 4 tumor shows highest TREM1 expression. (D) Pathway analysis of top 200 TREM1-correlated genes (Spearman correlation>0.5) from iCluster 1 and 3. (E) TUBA1C, CCNJL, PLK3, and HK3 expression associated with cell division exhibit positive correlation to TREM1 expression. (F) Immunofluorescence staining of LIHC patient samples shows significant overlap of TREM1 and α-feto protein. Original magnification, ×10; scale bar: 100μm. MFI = mean fluorescence intensity (n=6 per group) (G) RT-PCR confirms TREM1 expression in HCC cell lines and HCC patient P1. TREM1 expression was analyzed as fold change with resting THP-1 used as baseline indicated by a dashed line (n=4 per group). (H) Western blot analysis detects TREM1 protein level expression at varying levels across all HCC cell lines tested. ***p<0.001.
Figure 2
Figure 2
TREM1 knockout suppresses proliferation and migration while inducing apoptosis in HCC. (A) Western blot and (B) RT-PCR analysis confirms TREM1 knockout using CRISPR-Cas9 in Huh7 and HepG2 cell lines (n=3 per group). (C) Line graph shows CCK-8 assay assessing cell proliferation in control and TREM1 KO Huh7 and HepG2 cell lines (n=2–3 per group). (D) Cell migration in Huh7 and HepG2 cell lines, both control and TREM1 knockout groups assessed by in vitro transwell assay. Representative images of crystal violet staining captured at 24h. Number of migrated cells on each six-well plate counted in 3 independent experiments (n=3 per group) (E) Flow cytometry histogram plots depict Ki67-PI cell cycle analysis of control and TREM1 KO Huh7 and HepG2 cell lines. Representative plot from 3 independent experiments performed in triplicate (n=3 per group). (F) Flow cytometry analysis using Annexin V-PI staining shows significant increase in apoptosis during TREM1 silencing in Huh7 and HepG2 cell lines (n=3 per group). (G) RT2 PCR Array analysis of human apoptotic gene expression. Heatmap shows the expression of 84 key genes associated with apoptosis. Upregulated genes (red) and downregulated genes (blue) in Huh7 TREM1 KO cells shown. (H) Upregulation of pro-apoptotic genes and downregulation of anti-apoptotic genes in Huh7 TREM1 KO cells compared to the control group plotted using GraphPad Prism (version 9) (n=4–5 per group). ****p<0.0001.
Figure 3
Figure 3
TREM1 promotes tumorigenicity, clonogenic potential and spheroid formation in CD133+EpCAM+ liver cancer stem-like cells. (A) Flow cytometry dot plots reveal significant TREM1 expression in CD133+EpCAM+ cells from Huh7, and HepG2 cell lines and HCC P1 patient sample. (B) RT-PCR analysis shows significant expression of stem cell factors in MACS-purified Huh7 CD133+EpCAM+ cells in comparison to CD133-EpCAM- fractions (n=3 per group) (C) Flow cytometry dot plots depict reduction in CD133+Epcam+LCSLCs during TREM1 silencing in Huh7 and HepG2 cells (n=4 per group). (D) RT-PCR analysis of MACS-purified LCSLCs reveals a significant decrease in stem cell factor expression during TREM1 ablation (n=3 per group). (E) Western blot analysis shows significant expression of stem cell proteins in MACS purified Huh7 and HepG2 control CD133+EpCAM+ cells in comparison to TREM1 KO CD133+EpCAM+ cells. (F) Spheroid formation assay shows TREM1 abrogation significantly limits spheroid formation and overall proliferation of LCSLCs. Keyence microscope was used for the acquisition of bright field images. Scale bars = 50 μm. Spheroids were counted using ImageJ (n=3 per group) (G) Colony formation assay demonstrates TREM1-positive LCSLCs form significantly more colonies than their KO counterparts. Representative images show TREM1 KO and Control Huh7 and HepG2 LCSLC colonies stained using crystal violet after 14 days. Data were plotted using GraphPad Prism (n=3 per group). (H) Representative images of tumors from NSG CDX models. 5000 Huh7 CD133+EpCAM+ LCSLCs from Control and TREM1 KO groups were injected subcutaneously (n=6 mice per group). The experiment was independently repeated three times for statistical analysis. ***p<0.001, ****p<0.0001.
Figure 4
Figure 4
Bulk RNA sequencing and pathway analysis of CD133+EpCAM+ cells from Huh7 control and TREM1 KO cell lines. (A) Heat map created using K-means clustering of the top 10,000 differentially expressed genes (DEGs) reveals that TREM1 KO in Huh7 LCSLCs significantly impacts cell proliferation pathways. Each sample was analyzed in triplicate. (B) Pathway analysis using Gene Set Enrichment Analysis (GSEA). The lollipop plot highlights the downregulated Gene Ontology (GO) Biological Process pathways in TREM1 KO Huh7 LCSLCs. (C) The lollipop plot shows the GO cellular components inhibited by the TREM1 KO, emphasizing the nuclear structures and complexes impacted. (D) Volcano plot displays the DEGs between Huh7 Ctrl and Huh7 TREM1 KO CD133+EpCAM+ cells. Genes with a log2 fold change > 1 and adjusted p-value < 0.05 are highlighted in red, indicating significant upregulation, while those with a log2 fold change < -1 and adjusted p-value < 0.05 are highlighted in blue, indicating significant downregulation. This plot underscores the downregulation of TREM1 and cancer stem cell-associated genes in the Huh7 CD133+EpCAM+ TREM1 KO cells.
Figure 5
Figure 5
Bulk RNA sequencing and pathway analysis of CD133+EpCAM+ cells from HepG2 control and TREM1 KO cell lines. (A) Heat map created using K-means clustering of the top 10,000 differentially expressed genes (DEGs) reveals that TREM1 KO in HepG2 LCSLCs predominantly affects extracellular pathways. Each sample was analyzed in triplicate. (B) Pathway analysis using GSEA. The lollipop plot highlights the downregulated pathways in TREM1 KO HepG2 LCSLCs, focusing on significant extracellular pathways affected by the knockout. (C) The lollipop plot shows the GO cellular components inhibited by the TREM1 KO, emphasizing the extracellular structures and complexes impacted. (D) Volcano plot displays the DEGs between HepG2 Control and HepG2 KO CD133+EpCAM+ cells. Genes with a log2 fold change > 1 and adjusted p-value < 0.05 are highlighted in red, indicating significant upregulation, while those with a log2 fold change < -1 and adjusted p-value < 0.05 are highlighted in blue, indicating significant downregulation. This plot highlights the downregulation of TREM1 and cancer stem cell-associated genes in the HepG2 CD133+EpCAM+ TREM1 KO cells.
Figure 6
Figure 6
TREM1 inhibition via VJDT depletes LCSLCs, reduces tumor size, and decreases spheroid formation. (A) Tumor growth curves for Huh7 vehicle and VJDT treated mice (mean ± SEM, n=5 mice/group). Representative images of tumors from indicated groups on day 22. (B) Flow cytometry analysis shows a significant reduction in CD133+EpCAM+ LCSLCs in VJDT-treated tumors compared to the vehicle (n=4 per group). (C) Western blot analysis of two vehicle-treated and two VJDT-treated tumors shows reduced expression of stem cell-related proteins in VJDT-treated tumors. (D) Representative images from the spheroid formation assay demonstrate reduced spheroid formation following VJDT treatment. Scale bar = 50 µm. Spheroids were counted using ImageJ. **p<0.01, ***p<0.001, ns-not significant.

Similar articles

References

    1. Bray F, Ferlay J, Soerjomataram I, Siegel RL, Torre LA, Jemal A. Global cancer statistics 2018: GLOBOCAN estimates of incidence and mortality worldwide for 36 cancers in 185 countries. CA Cancer J Clin. (2018) 68:394–424. doi: 10.3322/caac.21492 - DOI - PubMed
    1. Rumgay H, Arnold M, Ferlay J, Lesi O, Cabasag CJ, Vignat J, et al. Global burden of primary liver cancer in 2020 and predictions to 2040. J Hepatol. (2022) 77:1598–606. doi: 10.1016/j.jhep.2022.08.021 - DOI - PMC - PubMed
    1. Llovet JM, Kelley RK, Villanueva A, Singal AG, Pikarsky E, Roayaie S, et al. Hepatocellular carcinoma. Nat Rev Dis Primers. (2021) 7:6. doi: 10.1038/s41572-020-00240-3 - DOI - PubMed
    1. McGlynn KA, London WT. The global epidemiology of hepatocellular carcinoma: present and future. Clin Liver Dis. (2011) 15:223–43. doi: 10.1016/j.cld.2011.03.006 - DOI - PMC - PubMed
    1. Forner A, Reig M, Bruix J. Hepatocellular carcinoma. Lancet. (2018) 391:1301–14. doi: 10.1016/S0140-6736(18)30010-2 - DOI - PubMed

MeSH terms

Substances