. 2025 Jul 17;7(3):lqaf094.
doi: 10.1093/nargab/lqaf094. eCollection 2025 Sep.

ganon2: up-to-date and scalable metagenomics analysis

Affiliations

ganon2: up-to-date and scalable metagenomics analysis

Vitor C Piro et al. NAR Genom Bioinform. .

Abstract

The fast growth of public genomic sequence repositories greatly contributes to the success of metagenomics. However, they are growing at a faster pace than the computational resources to use them. This challenges current methods, which struggle to take full advantage of massive and fast data generation. We propose a generational leap in performance and usability with ganon2, a sequence classification method that performs taxonomic binning and profiling for metagenomics analysis. It indexes large datasets with a small memory footprint, maintaining fast, sensitive, and precise classification results. Based on the full NCBI RefSeq and its subsets, ganon2 indices are on average 50% smaller than state-of-the-art methods. Using 16 simulated samples from various studies, including the CAMI 1+2 challenge, ganon2 achieved up to 0.15 higher median F1-score in taxonomic binning. In profiling, improvements in the F1-score median are up to 0.35, keeping a balanced L1-norm error in the abundance estimation. ganon2 is one of the fastest tools evaluated and enables the use of larger, more diverse, and up-to-date reference sets in daily microbiome analysis, improving the resolution of results. The code is open-source and available with documentation at https://github.com/pirovc/ganon.


Conflict of interest statement

None declared.

Figures

Figure 1.
Figure 1.
F1-score results for taxonomic binning at the species level (higher is better). Each tool and database combination (x-axis) has 16 points, one for each sample analyzed (Table 2), identified by a distinct marker and color, with a boxplot showing their overall distribution. The CAMI 2 mice dataset (cross) scored 0 for all methods because the ground truth is provided at the genus level.
Figure 2.
Figure 2.
Sensitivity and precision plot for taxonomic binning at the species level against the full RefSeq. Each tool has 16 points, one for each sample analyzed (Table 2). ganon2 achieved balanced results between the metrics.
Figure 3.
Figure 3.
Top: F1-score results for taxonomic profiling at the species level (higher is better). Bottom: L1-norm error results at the species level (lower is better). Each tool and database combination (x-axis) has 16 points, one for each sample analyzed (Table 2), identified by a distinct marker and color, with a boxplot showing their overall distribution. Results considering only species with abundance above 0.005% for all tools.
Figure 4.
Figure 4.
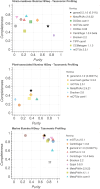
Completeness (sensitivity) and purity (precision) plot for taxonomic profiling at the species level. Data extracted from the CAMI Portal [32] on 30 March 2025, based on the average over all samples for each set. Only the best result for each combination of tool + versions was kept and the top 10 results for each set are presented. Tools are sorted in the legend based on their ranking, which is generated based on additional metrics not displayed. Values in parentheses in the legend show the minimum abundance threshold used for ganon2 results.
Figure 5.
Figure 5.
Completeness (sensitivity) and purity (precision) plot for taxonomic binning at the species level. Data extracted from the CAMI Portal [32] on 30 March 2025. Only the best result for each combination of tool + versions was kept. Tools are sorted in the legend based on their ranking, which is generated based on additional metrics not displayed.
Figure 6.
Figure 6.
Average abundances among the 28 samples from Bologna, Italy for each of the 44 genera reported by Becsei et al. [50] based on assembled data compared to the normalized averages obtained with ganon2 based on short-read data. Axis are in log scale. The dotted line is the diagonal slope used for reference.

References

    1. Quince C, Walker AW, Simpson JT et al. Shotgun metagenomics, from sampling to analysis. Nat Biotechnol. 2017; 35:833–44. 10.1038/nbt.3935. - DOI - PubMed
    1. Marx V Microbiology: the road to strain-level identification. Nat Methods. 2016; 13:401–4. 10.1038/nmeth.3837. - DOI - PubMed
    1. GenBank and WGS statistics. (6 September 2023, date last accessed)https://www.ncbi.nlm.nih.gov/genbank/statistics/.
    1. DNA sequencing costs: data. (6 September 2023, date last accessed)https://www.genome.gov/about-genomics/fact-sheets/DNA-Sequencing-Costs-Data.
    1. Arita M, Karsch-Mizrachi I, Cochrane G et al. The International Nucleotide Sequence Database Collaboration. Nucleic Acids Res. 2021; 49:D121–4. 10.1093/nar/gkaa967. - DOI - PMC - PubMed

LinkOut - more resources