. 2025 Jul 17;7(3):lqaf100.
doi: 10.1093/nargab/lqaf100. eCollection 2025 Sep.

Insight into the epigenetic regulation of gene expression in the bloodstream and procyclic forms of Trypanosoma brucei through the involvement of G-quadruplexes

Affiliations

Insight into the epigenetic regulation of gene expression in the bloodstream and procyclic forms of Trypanosoma brucei through the involvement of G-quadruplexes

Efres Belmonte-Reche et al. NAR Genom Bioinform. .

Abstract

This study explores how G-quadruplexes (G4s) influence gene expression during the transition between bloodstream (BF) and procyclic (PC) forms of Trypanosoma brucei brucei. Computational analysis identified over 115 000 G4-prone sequences, with 63% predicted to form stable G4 structures. These sequences are enriched in regions associated with antigenic variation, suggesting a role in gene regulation. Experimental validation using G4 ligands (AQ1, Pt-TTPY, and pyridostatin) showed a consistent downregulation of differentially expressed genes, supporting the potential relevance of targeting G4s. These results contribute to our understanding of epigenetic regulation in T. brucei and may help inform future approaches for managing parasitic infections.


Conflict of interest statement

None declared.

Figures

Figure 1.
Figure 1.
General information of T. brucei brucei Lister 427 (2018 genome), including all the chromosomes and other contigs. n is the number of DNA segments that are included in the chromosome/contigs in the deposited genome. Density per 105 nucleotides was calculated for G-runs, PQSs, and differentially expressed genes (DEGs). A bulge in a G-run is shown as X, where X can be any nucleotide except for G3X (the counts and densities of both GGXG and GXGG are given). In PQSs, ALL are PQSs independently of score (S.) ≥40 are PQSs with a HIGH G4 probability (score of at least 40). cG4s are PQS that have already been confirmed to form G4s in vitro in literature and that are within the G4-iM Grinder database. DEGs are differentially expressed genes between BF and PC. PQS average density of the human genome is shown as a comparison (version hg19). For G-runs, white tick in green ball is the highest at 80%; up green triangle is between 60% and 80%; down red triangle is between 40% and 60%; and white cross in red ball is <20% of the ordered chromosomic results within the column.
Figure 2.
Figure 2.
Most frequent PQSs in T. brucei brucei Lister 427 (2018). (A) PQSs with confirmed G4s (cG4s); Top, most frequent PQS with cG4s. Bottom, pie charts of the distribution of six selected PQS with cG4. (B) PQS not yet confirmed to form G4, with HIGH probability of G4-formation and G% ≤ 85%. Upper facet, most frequent sequences that include the 22Ag loop {TTA} but are not 22Ag (where TTA is highlighted in green). Lower facet, PQS not yet confirmed to form G4, with HIGH probability of G4-formation, G% ≤ 85% and without the {TTA} loop. Bottom, pie charts of the distribution of selected PQS without cG4. Frequency is abbreviated Freq.
Figure 3.
Figure 3.
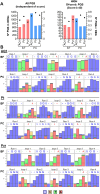
(A) Pie charts of total number of T. brucei brucei Lister 427 (2018)’s type features divided by features that present at least a PQS with HIGH G4 probability (score ≥40; blue), that present a PQS (independently of score; grey), and that are depleted of PQS (white). A PQS was considered to be within a feature if the PQS was within a ± 500 nucleotide range from the start and end of the feature. (B) Most interesting gene products of protein-coding genes and pseudogenes are categorized in groups by the presence of the term. The table is ordered considering the number of PQSs with HIGH G4 probability (score ≥40; abbreviated S. ≥40) and the total number of genes within the group. The total number of PQSs (without consideration of score) and the PQSs with a confirmed G4 (cG4s) within these genes are also given. The number of PQSs with HIGH G4 probability per gene in each group was calculated as the total number of PQSs with HIGH G4 probability divided by the total number of genes in the group.
Figure 4.
Figure 4.
(A) Table of all genes in T. brucei bruceiLister 427 (2018) genome arranged by being or not being differentially expressed genes between morphologies (DEGs). For each group, the average number of PQSs was calculated per gene, including the average number of PQSs independently of score (abbreviated ALL PQSs), the average number of PQSs with at least HIGH G4 probability (score ≥40, abbreviated S ≥40), and the average number of PQSs with a confirmed G4 within (abbreviated cG4). (B) Distribution of PQS numbers (as log10) and its relationship with the measured logFC in DEGs with PQSs for the three differently filtered groups (independently of score, with HIGH G4 probability, and with cG4s within). The linear relationship (as formula and coefficient of determination) is given as well as Spearman’s (rs) and Pearson’s (ρ) correlations for both down- and upregulated genes. (C) Table of DEGs classified by the presence or absence of at least one PQS independently of score and by regulation (up or down) and the group’s average and standard deviation logFC. (D) Table of DEGs classified by presence or absence of at least one PQS with HIGH G4 probability and by regulation (up or down) and the group’s average and standard deviation logFC. (E) Density plots and boxplots of genes with and without PQSs with HIGH G4 probability by their logFC.
Figure 5.
Figure 5.
(A) Antiparasitic activity of selected G4 ligands against T. brucei brucei Lister 427 (2018). BF is represented in red and PC in blue. The data represented are the average of three independent MTT assays. (B) Overall, of the G4 ligand’s effect on gene expression in BF and PC forms of T. brucei. (C) Venn diagram for the common (or not) DEG targeted for each G4 ligand in BF and PC. In orange AQ1, in green Pt-TTPY, and in blue pyridostatin. (D) Venn diagram for the common genes targeted for each G4 ligand in between BF (green) and PC (blue) forms and with respect to the DEG observed between BF and PC non-treated (orange). (E) DGE for the different treatments considering protein-coding genes (PcG), non-coding RNA genes (NcR), and pseudogenes (PsG). Statistical analysis data interpretation P-values (*P < .05, **P < .01; ***P < .001; ****P < .0001; ns, not significant.
Figure 6.
Figure 6.
(A) Number of PQSs identified in the DEGs after AQ1, Pt-TTPY (Pt), and pyridostatin (Pyr) treatment in BF (red) and PC (blue) and considering PQSs with different scores of forming probability. The black dots represent the average number of PQSs per DEGs gene for each treatment. (B) Consensus sequence plots for the PQSs with score ≥40 identified per G4 ligand used and morphology in DEGs. Probability is abbreviated as prob.

Similar articles

References

    1. Schuster S, Lisack J, Subota I et al. Unexpected plasticity in the life cycle of Trypanosoma brucei. eLife. 2021; 10:e66028. 10.7554/eLife.66028. - DOI - PMC - PubMed
    1. Kolev NG, Franklin JB, Carmi S et al. The transcriptome of the human pathogen Trypanosoma brucei at single-nucleotide resolution. PLoS Pathog. 2010; 6:e1001090. 10.1371/journal.ppat.1001090. - DOI - PMC - PubMed
    1. Vasquez J-J, Hon C-C, Vanselow JT et al. Comparative ribosome profiling reveals extensive translational complexity in different Trypanosoma brucei life cycle stages. Nucleic Acids Res. 2014; 42:3623–37. 10.1093/nar/gkt1386. - DOI - PMC - PubMed
    1. Maree JP, Patterton H-G The epigenome of Trypanosoma brucei: a regulatory interface to an unconventional transcriptional machine. Biochim Biophys Acta. 2014; 1839:743–50. 10.1016/j.bbagrm.2014.05.028. - DOI - PMC - PubMed
    1. Siegel TN, Hekstra DR, Kemp LE et al. Four histone variants mark the boundaries of polycistronic transcription units in Trypanosoma brucei. Genes Dev. 2009; 23:1063–76. 10.1101/gad.1790409. - DOI - PMC - PubMed

MeSH terms

LinkOut - more resources