

The Impact of the COVID-19 Pandemic on Influenza Vaccination Coverage Among Young U.S. Children: A Socioeconomic Analysis
- PMID: 40678053
- PMCID: PMC12269500
- DOI: 10.3390/covid5020020
The Impact of the COVID-19 Pandemic on Influenza Vaccination Coverage Among Young U.S. Children: A Socioeconomic Analysis
Abstract
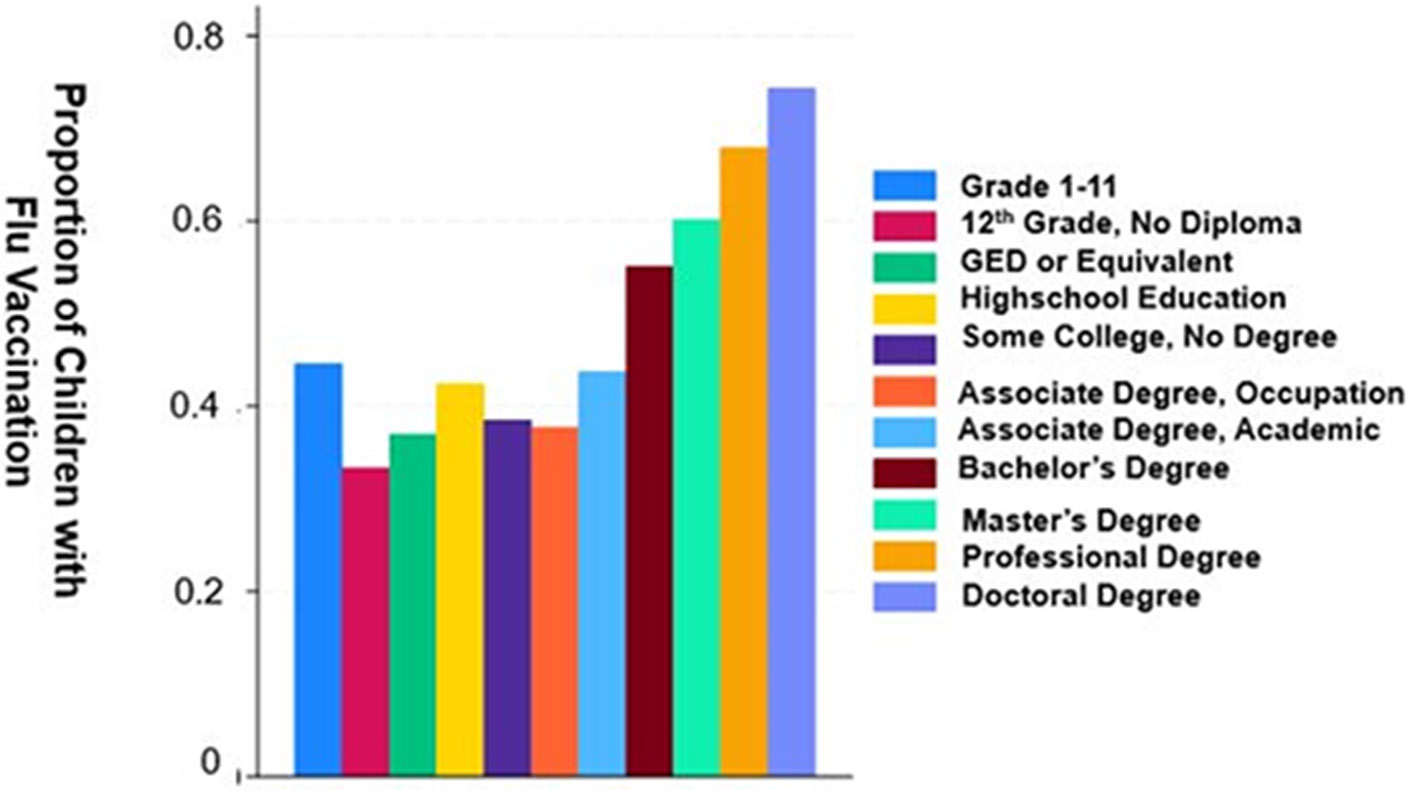
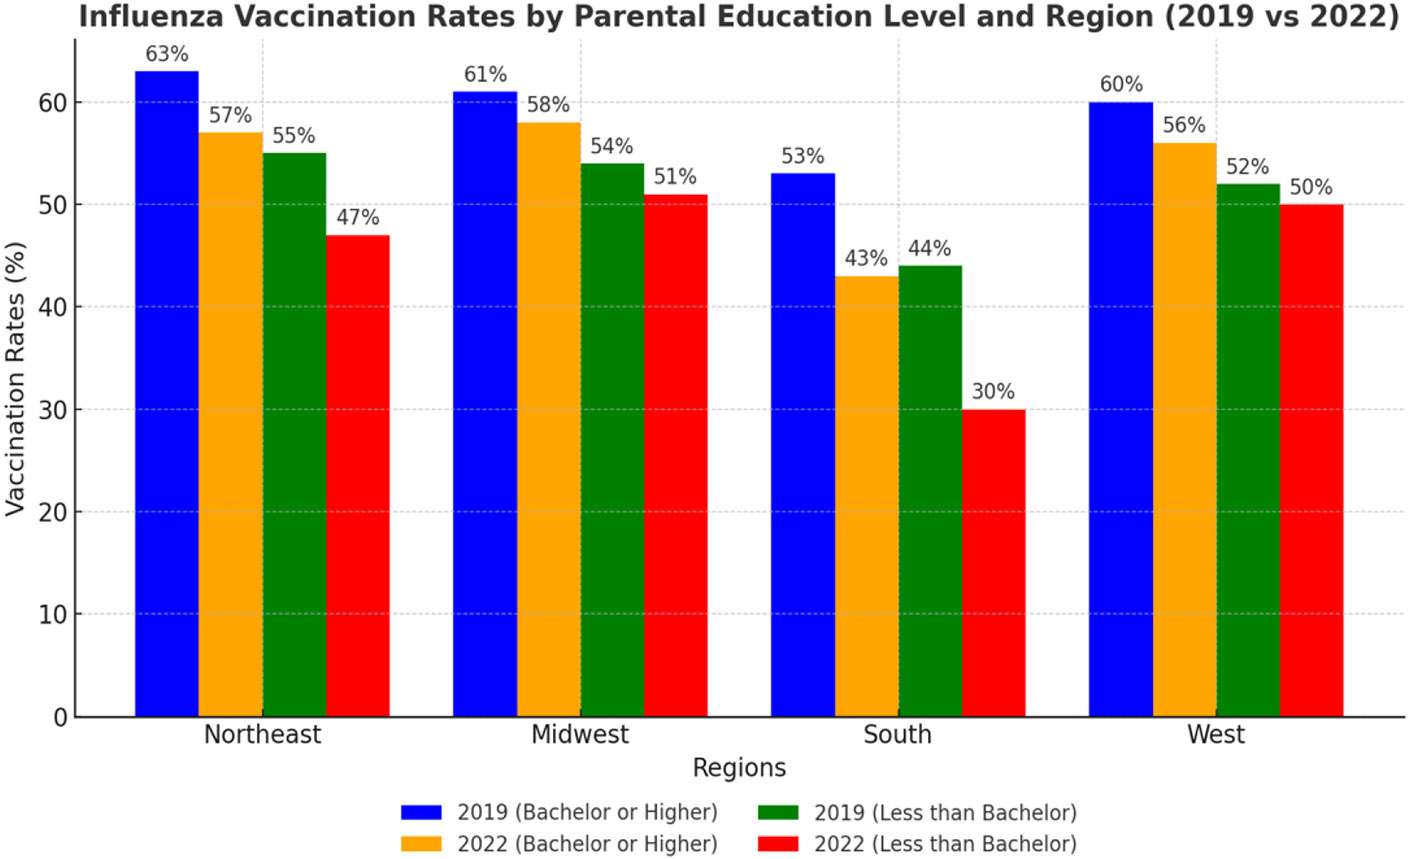
The COVID-19 pandemic disrupted healthcare delivery across the United States (U.S.), including childhood vaccine administration. This study analyzed data from the National Health Interview Survey (NHIS), a nationally representative survey of the U.S. population, assessing trends and predictors of influenza vaccination uptake among children ≤ 5 years before and amid the COVID-19 pandemic. Influenza vaccination coverage declined significantly, from 56% in 2019 to 46% in 2022 (p < 0.001). Age-specific declines were notable, with rates dropping among one-year-olds from 68% to 53%, two-year-olds from 63% to 49%, and infants from 31% to 24% (p < 0.001). Logistic regression revealed African American children had lower odds of vaccination compared to non-Hispanic White children (OR = 0.70, p < 0.001), while Asian children had higher odds (OR = 1.32, p = 0.018). Uninsured children were less likely to be vaccinated than insured children (OR = 0.71, p = 0.022). Regional analysis showed the Northeast had the highest vaccination rates (60% in 2019, 56% in 2022), while the South had the lowest (52% in 2019, 41% in 2022). These findings underscore the need for targeted strategies to address socioeconomic disparities and improve influenza vaccine uptake in young children in the U.S.
Keywords: COVID-19 pandemic; children; influenza vaccination; public health strategies; socioeconomic disparities.
Conflict of interest statement
Conflicts of Interest: The authors declare no conflict of interest.
Figures
Similar articles
-
Service Interruption in HIV Care Amid COVID-19 Pandemic in Myanmar: Results From Analysis of Routine Program Data 2018-2022.J Int Assoc Provid AIDS Care. 2024 Jan-Dec;23:23259582241299466. doi: 10.1177/23259582241299466. J Int Assoc Provid AIDS Care. 2024. PMID: 39648608 Free PMC article.
-
Influenza Vaccination Coverage and Determinants of New Vaccinations During the COVID-19 Pandemic in Spain (ENE-COVID): Nationwide Population-Based Study.JMIR Public Health Surveill. 2025 Jul 1;11:e60658. doi: 10.2196/60658. JMIR Public Health Surveill. 2025. PMID: 40591528 Free PMC article.
-
Vaccines for preventing influenza in healthy children.Cochrane Database Syst Rev. 2018 Feb 1;2(2):CD004879. doi: 10.1002/14651858.CD004879.pub5. Cochrane Database Syst Rev. 2018. PMID: 29388195 Free PMC article.
-
Vaccines for preventing influenza in healthy adults.Cochrane Database Syst Rev. 2018 Feb 1;2(2):CD001269. doi: 10.1002/14651858.CD001269.pub6. Cochrane Database Syst Rev. 2018. PMID: 29388196 Free PMC article.
-
Surveillance for Violent Deaths - National Violent Death Reporting System, 50 States, the District of Columbia, and Puerto Rico, 2022.MMWR Surveill Summ. 2025 Jun 12;74(5):1-42. doi: 10.15585/mmwr.ss7405a1. MMWR Surveill Summ. 2025. PMID: 40493548 Free PMC article.
References
-
- Centers for Disease Control and Prevention. Disease Burden of Flu. Available online: https://www.cdc.gov/flu-burden/php/data-vis/index.html (accessed on 14 December 2024).
-
- Centers for Disease Control and Prevention. Weekly Flu Vaccination Dashboard. Available online: https://www.cdc.gov/fluvaxview/dashboard/index.html (accessed on 12 December 2024).
-
- Centers for Disease Control and Prevention. Estimated Flu Disease Burden 2021-2022 Flu Season. Available online: https://www.cdc.gov/flu-burden/php/data-vis/2021-2022.html (accessed on 12 December 2024).
-
- Committee on Infectious Diseases. Recommendations for prevention and control of influenza in children, 2022–2023. Pediatrics 2022, 150, e2022058826. - PubMed
Grants and funding
LinkOut - more resources
Full Text Sources