. 2025 Jul 3:15:1595523.
doi: 10.3389/fonc.2025.1595523. eCollection 2025.

FN1 from cancer-associated fibroblasts orchestrates pancreatic cancer metastasis via integrin-PI3K/AKT signaling

Affiliations

FN1 from cancer-associated fibroblasts orchestrates pancreatic cancer metastasis via integrin-PI3K/AKT signaling

Xianguang Zhu et al. Front Oncol. .

Abstract

Objective: The metastasis of pancreatic ductal adenocarcinoma (PDAC) is closely linked to the remodeling of cancer-associated fibroblasts (CAFs) within the tumor microenvironment (TME), though the precise molecular mechanisms remain unclear. This study aims to elucidate the role of CAFs in PDAC metastasis.

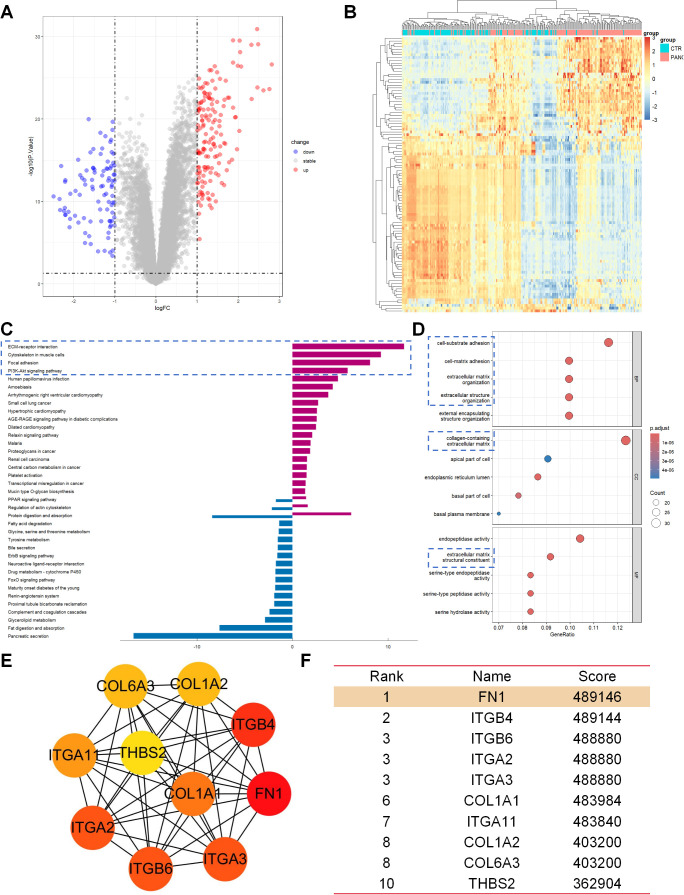
Methods: We integrated transcriptomic (GSE183795) and single-cell sequencing data (GSE156405) to screen for core genes associated with PDAC. In vitro co-culture models, functional assays (Transwell migration, Western blotting, qRT-PCR), and clinical data analysis were employed.

Results: Multi-omics analysis identified FN1 as a pivotal hub gene in the PI3K pathway, highly expressed in metastatic CAF subsets. In vitro experiments confirmed that FN1 activates the PI3K/AKT pathway through integrin receptors, influencing cell invasion and the immune microenvironment. Combined inhibition of the PI3K/AKT pathway and integrins synergistically suppressed tumor invasion. Clinical data showed that high FN1 expression correlated with shortened patient survival and an immunosuppressive microenvironment (M2 macrophage/Treg cell infiltration).

Conclusion: FN1 directly drives PDAC metastasis via the integrin-PI3K/AKT axis and indirectly promotes a "cold tumor" microenvironment by recruiting immunosuppressive cells. This dual role of FN1 enhances our understanding of CAFs heterogeneity and offers novel therapeutic strategies for PDAC.

Keywords: cancer-associated fibroblasts; fibronectin 1; integrin-PI3K/AKT signaling axis; metastasis; pancreatic cancer.


Conflict of interest statement

The authors declare that the research was conducted in the absence of any commercial or financial relationships that could be construed as a potential conflict of interest.

Figures

Figure 1
Figure 1
Transcriptome analysis revealed the central role of the ECM-PI3K pathway in pancreatic cancer metastasis. (A) Volcano plot of differentially expressed genes (DEGs), showing 248 DEGs between pancreatic cancer tissues (PANC) and adjacent normal tissues (CTR), with 153 genes upregulated and 95 genes downregulated. (B) Hierarchical clustering heatmap of the top 100 DEGs, demonstrating differences in gene expression patterns between PANC and CTR tissues. (C) Results of KEGG functional enrichment analysis, indicating that the DEGs are primarily involved in signaling pathways such as ECM-receptor interaction, Cytoskeleton in muscle cells, Focal adhesion, and P13K/AKT signaling pathway. (D) GO analysis results, showing significant enrichment of DEGs in processes related to adhesion and ECM. (E, F) CytoHubba analysis results, revealing FN1 as a core hub gene in the P13K/AKT signaling pathway.
Figure 2
Figure 2
Single-cell sequencing identifies specific expression patterns of PI3K-related genes including FN1 in fibroblasts of metastatic samples. (A) UMAP plot displaying the sub-cell types in the primary pancreatic cancer (stiu) and liver metastasis (meta) samples from the single-cell RNA sequencing dataset GSE156405. (B) UMAP plot showing the expression patterns of different groups in primary pancreatic cancer (stiu) and liver metastasis (meta) samples. (C) Cell proportion plot illustrating the distribution of different cell types in stiu and meta samples. (D) Bubble plot representing the relationship between different sub-cell types and characteristic gene expression. The color of the bubbles ranges from white to blue, representing gene expression percentages of 0%, 25%, 50%, and 75%, respectively. The size of the bubbles indicates the average expression level, ranging from a minimum to a maximum representing average expression values from 0 to 2. (E) KEGG enrichment analysis of DEGs in alveolar epithelial cells. (F) KEGG enrichment analysis of DEGs in fibroblasts. (G) Violin plot showing the expression patterns of PI3K-related genes (FN1, THBS2, COL1A1, COL1A2, and COL6A3) in different cell types and groups in fibroblasts.
Figure 3
Figure 3
Core mechanisms of CAFs in pancreatic cancer metastasis. (A) UMAP plot displaying fibroblast subpopulations by cluster. (B) UMAP plot showing the distribution of fibroblast subpopulations by group. (C) Proportion plot illustrating the cell proportions by cell subpopulation and group. (D) Identification of the CAFs subpopulation among fibroblast subpopulations. (E) UMAP visualization analysis, displaying the expression patterns of FN1, THBS2, COL1A1, COL1A2, and COL6A3 in the stiu and meta groups.
Figure 4
Figure 4
CAF-derived FN1 promotes invasion and migration of pancreatic cancer cells. (A) Schematic diagram of the CAFs-PANC1 co-culture model. (B) ELISA results showing changes in IL-6, IL-8, and MMP2 levels secreted by CAFs before and after TGF-β induction. (C) ELISA results demonstrating changes in FN1 levels secreted by CAFs before and after treatment with FN1 neutralizing antibody (FN1-Ab). (D) Transwell migration assay showing changes in the number of migrated cells in the FN1-Ab group compared to the control group. (E) Statistics of migration rates from the Transwell migration assay. (F) Transwell invasion assay showing changes in the number of invading cells in the FN1-Ab group compared to the control group. (G) Statistics of invasion rates from the Transwell invasion assay.
Figure 5
Figure 5
The FN1-ITG-PI3K/AKT axis promotes invasion and migration of pancreatic cancer cells. (A, B) GEPIA database analysis revealing a significant positive correlation between FN1 expression and the expression of key genes in the PI3K/AKT pathway (PIK3CA, AKT1). (C, D) Western blot results showing changes in phosphorylation levels of p-AKT and p-PI3K in the FN1-Ab group. The Western blot results demonstrated the changes in the phosphorylation levels of p-AKT and p-PI3K in the FN1-Ab groups of PANC-1 and BXPC-3 cells. (E, F) Statistical data corresponding to (C, D). (G, H) mRNA expression changes of integrin genes (ITGA2, ITGB4, ITGA3) before and after treatment with an integrin inhibitor (ITG-Inh). The changes in mRNA expression of integrin genes ITGA2, ITGB4, and ITGA3 in PANC-1 and BXPC-3 cells before and after treatment with the integrin inhibitor ITG-Inh. (I, J) Western blot results demonstrating changes in protein levels of p-AKT and p-PI3K in the ITG-Inh group compared to the control group (ITG-Con). The Western blot results indicated that in PANC-1 and BXPC-3 cells, compared with the control group (ITG-CON), the protein levels of p-AKT and p-PI3K in the ITG-Inh group were altered. (K, L) Statistical data corresponding to (I, J). (M, N) Changes in invasion ability after combined inhibition of PI3K and integrins (PI3K-Inh + ITG-Inh). The changes in invasive capacity following the combined inhibition of PI3K and integrins (PI3K-Inh + ITG-Inh) in PANC-1 and BXPC-3 cells. (O, P) Statistical data corresponding to (M, N).
Figure 6
Figure 6
High FN1 expression is associated with poor prognosis and an immunosuppressive microenvironment. (A) Clinical data analysis showing the relationship between FN1 expression and patient survival. (B) TIMER2.0 displaying the correlation between FN1 expression and M2 macrophage infiltration in pancreatic cancer (PAAD). (C) TIMER2.0 showing the correlation between FN1 expression and Treg cell infiltration in PAAD. (D) Mechanism diagram illustrating how FN1 activates the PI3K/AKT pathway by binding to integrin receptors, thereby promoting the invasion and metastasis of pancreatic cancer cells.

Similar articles

References

    1. Xu W, Xu J, Liu J, Wang N, Zhou L, Guo J. Liver metastasis in cancer: molecular mechanisms and management. MedComm (2020). (2025) 6:e70119. doi: 10.1002/mco2.70119 - DOI - PMC - PubMed
    1. Jazieh K, Tsai J, Solomon S, Zhu M, Sinicrope FA, Pedersen KS, et al. Identification of candidate alterations mediating KRASG12C inhibitor resistance in advanced colorectal and pancreatic cancers. Clin Cancer Res. (2025) 31:899–906. doi: 10.1158/1078-0432.CCR-24-2948 - DOI - PMC - PubMed
    1. Huang X, Ding L, Liu X, Tong R, Ding J, Qian Z, et al. Regulation of tumor microenvironment for pancreatic cancer therapy. Biomaterials. (2021) 270:120680. doi: 10.1016/j.biomaterials.2021.120680 - DOI - PubMed
    1. Sherman MH, Beatty GL. Tumor microenvironment in pancreatic cancer pathogenesis and therapeutic resistance. Annu Rev Pathol. (2023) 18:123–48. doi: 10.1146/annurev-pathmechdis-031621-024600 - DOI - PMC - PubMed
    1. Glaviano A, Lau HS, Carter LM, Lee EHC, Lam HY, Okina E, et al. Harnessing the tumor microenvironment: targeted cancer therapies through modulation of epithelial-mesenchymal transition. J Hematol Oncol. (2025) 18:6. doi: 10.1186/s13045-024-01634-6 - DOI - PMC - PubMed

LinkOut - more resources