[Preprint]. 2025 Jun 26:rs.3.rs-6658954.
doi: 10.21203/rs.3.rs-6658954/v1.

Identification of Chlamydia pneumoniae and NLRP3 inflammasome activation in Alzheimer's disease retina

Affiliations

Identification of Chlamydia pneumoniae and NLRP3 inflammasome activation in Alzheimer's disease retina

Bhakta Prasad Gaire et al. Res Sq. .

Abstract

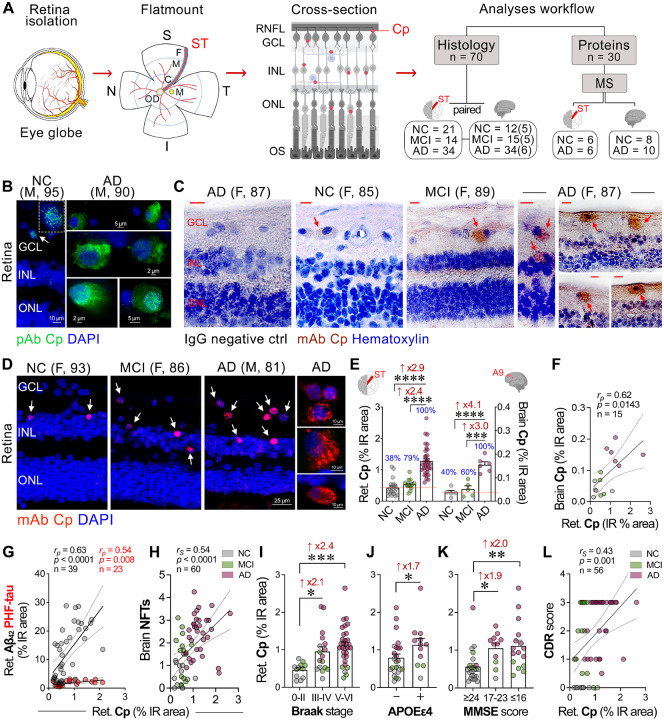
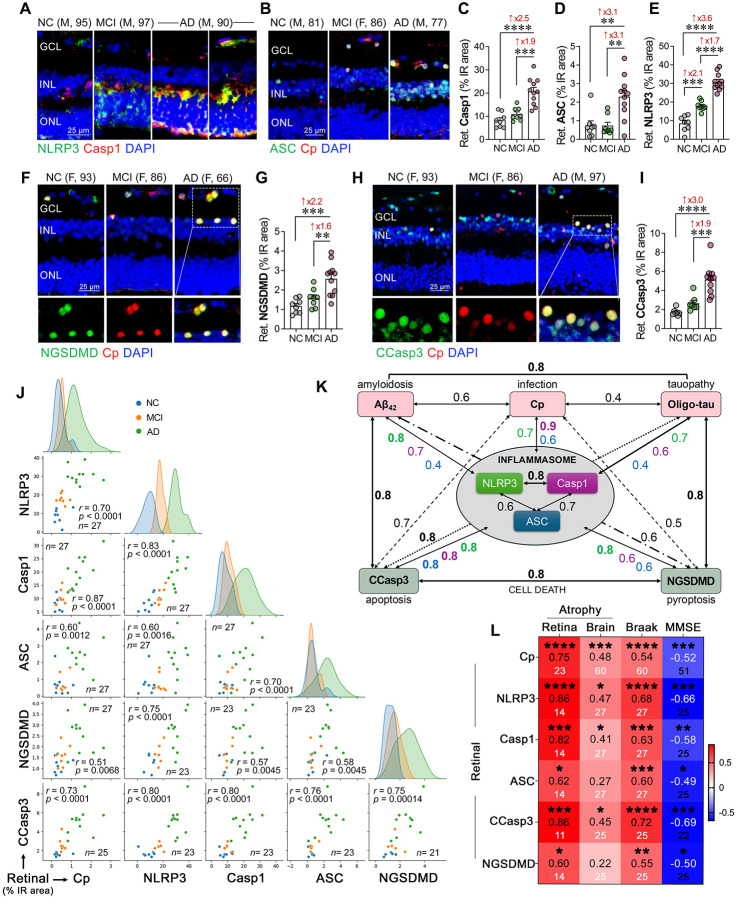
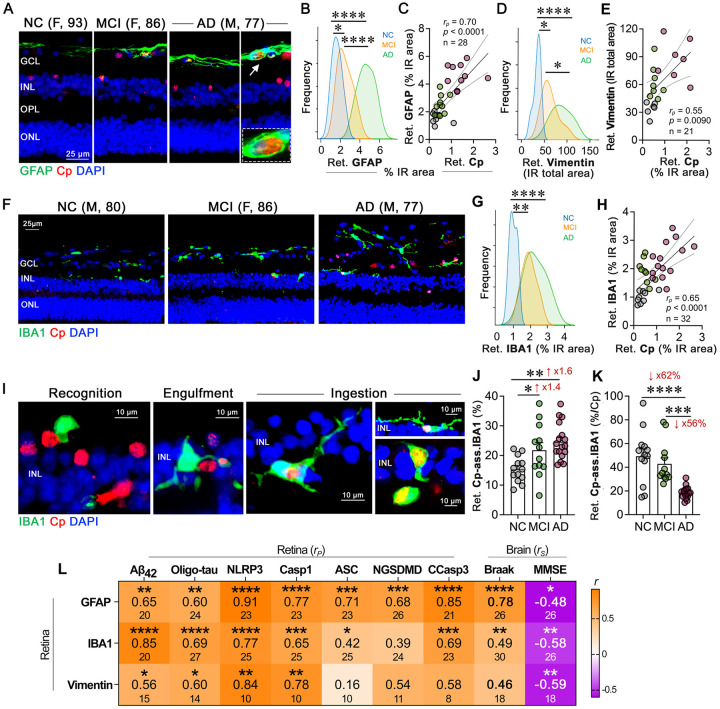
Emerging evidence implicates bacterial infections, including Chlamydia pneumoniae (Cp), a gram-negative obligate intracellular bacterium responsible for community-acquired pneumonia, in Alzheimer's disease (AD) pathogenesis. However, the involvement of Cp in early and advanced AD in the retina is unknown. Here, we identified the existence and distribution of intracellular Cp inclusions and related NLRP3 inflammasome activation and neurodegeneration in postmortem retinas and brains from 95 human donors. Histological analysis in neuropathologically-confirmed MCI and AD patients compared with cognitively normal individuals (n=70), revealed 2.9-4.1-fold increases of Cp inclusions in AD retinas and brains, respectively, with no significant increases in MCI retinas or brains. Mass spectrometry-based proteomics in additional cohorts (n=30), revealed dysregulated brain and retinal bacterial infection-related proteins and inflammasome-associated pathways. Retinal Cp was strongly linked to Aβ42, caspase-1 and NLRP3-inflammasome activation components, as well as cleaved caspase-3+ apoptosis and cleaved gasdermin D pyroptotic cell death. Despite increased IBA1+ microgliosis in the AD retina, the Cp-associated microglial population was reduced by 62%, suggesting impaired microglial phagocytosis. Higher retinal Cp burden correlated with APOEε4 status, advanced Braak stage, and cognitive decline. Machine learning models revealed that retinal Cp or NLRP3, in combination with retinal Aβ42, effectively predicted AD diagnosis, Braak stage, and cognition. These findings suggest that Cp infection contributes to AD dementia but is unlikely to initiate AD pathological changes, whereas elevated retinal NLRP3 may serve as an early AD marker. These results underscore the need for future studies investigating Cp's role in AD dementia and testing early antibiotic or inflammasome-targeting therapies.

Keywords: Alzheimer’s disease; Chlamydia pneumoniae (Cp); NLRP3 inflammasome; apoptosis; gliosis; machine learning; retina.


Conflict of interest statement

Conflict of interest All other authors declare no conflict of interest related to this work. Unrelated to this study: YK, KLB, and MKH are co-founding members in NeuroVision Imaging, Inc., Sacramento, CA, USA. Additional Declarations: There is NO Competing Interest.

Figures

Figure 1.
Figure 1.. Identification of Chlamydia pneumoniae (Cp) inclusions in retinas and brains from MCI and AD patients: correlations with disease status.
A. Illustration of retinal isolation and cross-section preparation from donor eyes. Retina was geometrically divided into four quadrants: superior (S), temporal (T), inferior (I), and nasal (N). A retinal strip (~2–3 mm), from the superior-temporal (ST) region extending from the optic disc (OD) to the ora serrata, was isolated and processed into retinal cross-sections for histopathological and proteomics analyses. This strip was further divided into subregions: central (C), mid-periphery (M), and far periphery (F). Red dots in the schematic retinal cross-section represent the presence of Cp inclusions identified across retinal cell layers. Right panel depicts the analyses workflow for the cohort size in each experiment. The numbers in parenthesis for brain histology indicate the subset of subjects analyzed for Cp immunoreactivity. B. Representative immunofluorescence micrographs of retinal cross-sections stained with pAb against Cp, with cytosolic inclusions shown in green (arrows), in retinal GCL of a human donor with AD compared with NC controls. C. Representative micrographs of peroxidase-based immunohistochemistry analysis of Cp inclusions (brown) in cells (nuclei; hematoxylin) stained with mAb in retinal cross-sections from MCI and AD patients versus NC controls (Left image, IgG negative control in the retina of an AD patient). Scale bars: 10 μm. D. Representative immunofluorescence images of retinal cross-sections from MCI and AD patients versus NC controls, indicated the presence of specific Cp inclusions (red; white arrows), using the mAb against Cp, in cells (nuclei, DAPI) across several retinal layers (right images are of higher magnification showing cytosolic Cp inclusions in AD retinas. E. Bar graphs display the quantitative analyses of retinal and paired-brain Cp-immunoreactive (IR) percentage area in age- and sex-matched human donors with MCI (due to AD) and AD dementia versus NC controls [for retinal analysis (n = 21 NC, 14 MCI, and 34 AD), for paired-brain analysis (n = 5 NC, 5 MCI, and 6 AD)]. The analyzed ST retina and the Area 9 (located in the dorsolateral prefrontal cortex) from the paired brain were demarcated with red color. The percentage of Cp-positive individuals was determined by having a higher value than the mean % IR area of Cp in the NC group (red line), for each CNS tissue. F. Pearson correlation (rp) analysis between retinal and paired-brain Cp burdens. G, H. Pearson correlation (rp) analyses between retinal Cp burden and (G) retinal Aβ42 (grey dots) and retinal paired helical filament (PHF)-Tau (red dots) % IR areas, and (H) brain NFT severity score. I-K. Retinal Cp burden per (I) Braak stage stratification, 0-II (n = 12), III-IV (n = 17), and V-VI (n = 31), (J) individuals carriers (n = 12) or non-carriers (n = 25) of APOE ɛ4 allele(s), and (K) mini-mental state examination (MMSE) cognitive score categories, ≥ 24 (n = 24), ≥ 17–23 (n = 9), ≤ 16 (n = 14). L. Pearson’s correlation (rp) analysis between retinal Cp burden and clinical dementia rating (CDR) score. Data from individual subjects (circles) as well as group means ± SEMs are shown. Fold changes are indicated in red. *p < 0.05, **p < 0.01, ***p < 0.001, and ****p < 0.0001, by one-way ANOVA and Tukey’s post hoc multiple comparison test or by two-tailed paired unpaired Student’s t test for two-group comparison.
Figure 2.
Figure 2.. Bacterial infection-associated proteome pathways in AD retina and cerebral cortex.
A-B. Gene ontology (GO) analysis of differentially expressed proteins (DEPs) related to bacterial infection (A) in the cerebral temporal cortex and (B) in the temporal hemi-retina from 2 separate cohorts of human donors with AD (brain: n = 10; retina: n = 6) versus NC (brain: n = 8; retina: n = 6) subjects. The analysis was carried out in Metascape and included the Reactome, Kyoto Encyclopedia of Genes and Genomes (KEGG) and WikiPathways (WikiPath) databases. Red arrows indicate the shared pathways between brain and retina. Bar and symbol graphs represent z-scores and Benjamini-Hochberg adjusted p-values from Metascape analysis, respectively. Range of p-values are presented as color-coded symbols. C-D. Volcano plots display the fold changes [log2(FC)] and significance level [-log10(p)] (C) in the cerebral cortex and (D) in the retina of AD versus NC subjects for proteins known to interact with Chlamydia inclusion membrane/vacuole. The list of human interacting proteins (termed ‘Chlamydia interactome’) was extracted from 4 original studies and a meta-analysis study and comprises 787 human proteins. Top 10 DEPs by FC upregulated (orange) and downregulated (purple) interactors are shown. The highlighted proteins (5 downregulated: AP2M1, RTN4, STT3B, TECR, TMED4; 5 upregulated: ATP6V1G1, BAG3, HSPB1, LRRFIP1, TPM3) were found in both the temporal cortex and the retina (F). E. GO network (Metascape) of enriched retinal pathways related to bacterial infection, immune response and cell death, including the apoptotic mitochondrial collapse. The size of the nodes represents the number of DEPs in AD versus NC retina, with the inner ring showing the proportion of these DEPs that are downregulated (purple) or upregulated (orange) in AD. The green border and its thickness represent the number of DEPs that interact with Chlamydia inclusion in each pathway. The thickness of edges between nodes represents the shared DEPs (association score) between pathways. Red asterisks indicate pathways that were further explored and validated. F. Heatmaps of upregulated (orange) and downregulated (purple) DEPs [−log10(p) and FC] in AD versus NC retina for selected pathways. Only proteins connected to gram-negative bacterial infection (Metascape analysis) and Chlamydia infection (Chlamydia interactome and literature) are shown for each pathway. The heatmap on the left corresponds to the protein expression level in the 6 NC individuals and the 6 AD patients, normalized by unit variance scaling and generated in ClustVis. Clustering of DEPs was carried out manually based on their involvement in selected pathways for visual clarity.
Figure 3.
Figure 3.. Retinal NLRP3 inflammasome, pyroptotic, and apoptotic markers and associations with Cp infection in early and advanced AD.
A-B. Representative immunofluorescence images of retinal cross-sections from MCI and AD patients versus NC controls stained for NLRP3 inflammasome activation markers: A. NLRP3 (green), Caspase-1 (Casp1, red), and DAPI (nuclei, blue), and B. ASC (green), Cp inclusions (red), and DAPI (nuclei, blue); right panel, higher magnification images with separate channels showing ASC+ signals colocalized with Cp-infected cells within the INL (yellow). C-E. Quantitative IHC analysis of retinal, C. Casp1, D. ASC and E. NLRP3 percentage IR area in donors with NC (n = 8), MCI (due to AD; n = 8), and AD dementia (n = 11). F. Representative immunofluorescence image of retinal cross-sections from MCI and AD patients versus NC controls stained for the pyroptotic marker, N-terminal gasdermin D (NGSDMD, green), Cp inclusions (mAb; red), and DAPI (nuclei, blue). F. Lower image panel, separate channels showing NGSDMD+ cells infected with Cp located in the retinal INL and GCL (yellow). G. Quantitative analysis of retinal NGSDMD percentage IR area in donors with NC (n = 8), MCI (n = 8), and AD (n = 11). H. Representative immunofluorescence images of retinal cross-sections from MCI and AD patients versus NC controls stained for the apoptotic marker, cleaved caspase-3+ (CCasp3+, green), Cp inclusions (red), and DAPI (nuclei, blue). H. Lower image panel, high magnification images with separate channels showing CCasp3+ cells infected with Cp localized within retinal INL (yellow). I. Quantitative analysis of retinal CCasp3 percentage IR area in subset donors with NC (n = 7), MCI (n = 7), and AD (n = 11). Scale bars: 50 μm. J. Multivariable Pearson’s correlation coefficient (rp) analyses are presented by scatter plots and adjusted p values, to assess the relationships between the retinal markers, including Cp, NLRP3, Casp1, ASC, CCasp3—apoptosis, and NGSDMD—pyroptosis. Gaussian distribution curves for each marker are also presented. K. Schematic representation depicting the strength (rP) of association between various retinal marker within three categories: 1. Inflammasome activators (Cp, Aβ42, and oligomeric tau), 2. NLRP3 inflammasome activation markers (NLRP3, Casp1, and ASC), and 3. Cell death (CCasp3 and NGSDMD). Pearson’s correlation rp values are highlighted in bold for very strong correlations (≥ 0.8), with associations to NLRP3, Casp1, and ASC indicated in green, purple, and blue, respectively, while other interactions are marked in black. L. Heatmap depicting pairwise Pearson’s correlations (rp) between retinal Cp-related markers and retinal atrophy, whereas pairwise Spearman’s rank correlations (rs) are between retinal Cp-related markers and brain atrophy, Braak stage, and MMSE score. Stars present the level of significance by unadjusted p values, values in middle row are rp or rs, and lower values are the sample sizes. Data from individual subjects (circles) and group means ± SEMs are shown. Fold changes are indicated in red. Statistical significance is denoted as *p < 0.05, **p < 0.01, ***p < 0.001, and ****p < 0.0001, determined by one-way ANOVA with Tukey’s post hoc multiple comparison test.
Figure 4.
Figure 4.. Cp-associated glial activation and phagocytosis in MCI and AD retina.
A. Representative immunofluorescence images of retinal cross-sections from MCI and AD patients versus NC controls stained with the marker of macrogliosis (GFAP, green), Cp (mAb, red), and nuclei (DAPI, blue). High magnification images of Cp-infected retinal astrocytes at the NFL/GCL are shown in the right panel (Cp inclusions are engulfed by retinal GFAP+ astroglia). B. Gaussian distribution curves display quantitative analysis of retinal GFAP-immunoreactivity (IR) % area (frequency) in donors with NC (n = 8), MCI (due to AD; n = 10), and AD dementia (n = 10). C. Pearson’s correlation (rp) analysis between retinal Cp and GFAP % IR area in the same cohort. D. Gaussian distribution curves display the quantitative analysis of retinal vimentin (total IR area) in donors with NC (n = 6), MCI (n = 8), and AD (n = 7). E. Pearson’s correlation (rp) analysis between retinal Cp (% IR area) and vimentin (total IR area) in the same cohort. F. Representative immunofluorescence images of retinal cross-sections from MCI and AD patients versus NC controls stained with the microglial marker (IBA1, green), Cp (red), and nuclei (DAPI, blue). G. Gaussian distribution curves display quantitative analysis of retinal IBA1 % IR area in donors with NC (n = 9), MCI (n = 9), and AD (n = 14). H. Pearson correlation (rp) analysis between retinal Cp and IBA1 % IR area in the same cohort. I. Immunofluorescence images of retinal cross-sections show three distinct stages of microglial (green) involvement in the phagocytosis of Cp-infected cells (red): recognition (left image, microglial attached to Cp-infected cells), engulfment (second image, microglia cell processes surrounding Cp-infected cells), and ingestion (final three images, microglial internalization of Cp-infected cells). J. Quantitative analysis of Cp-associated IBA1-positive cells involved in recognition, engulfment, and ingestion of Cp-infected cells in donors with NC (n = 13), MCI (due to AD; n = 12), and AD dementia (n = 17). K. Quantitative analysis of retinal Cp-associated IBA1-positive cells per Cp burden (% IR area). L. Heatmap depicting Pearson’s correlations (rp) between retinal gliosis (GFAP- or vimentin-astrogliosis and IBA1-microgliosis) and retinal amyloidosis (Aβ42), tauopathy (oligo-tau), NLRP3 inflammasome activation (NLRP3, Casp1, ASC), and cell death (NGSDMD-pyroptosis, CCasp3-apoptosis). Spearman’s rank correlations (rs) were performed to assess associations between retinal gliosis, Braak stage (brain), and MMSE score (cognition). Stars present the level of significance by unadjusted p values, values in middle row are rp or rs, and lower values are the sample sizes. Data from individual subjects (circles) as well as group means ± SEMs are shown. Fold or % changes are shown in red. *p < 0.05, **p < 0.01, ***p < 0.001, and ****p < 0.0001, by one-way ANOVA and Tukey’s post hoc multiple comparison test.
Figure 5.
Figure 5.. Multivariable predictions of brain AD pathology and cognitive dysfunction conferred by retinal Cp, NLRP3, CCasp-3, and Aβ42 markers.
Random forest regressor using 80 estimators was trained on the data to predict several brain pathologies, including A. ABC average, B. Braak stage, C. brain gliosis, and D. mini-mental state examination (MMSE) score. The distributions show the spread of models trained on different folds of the 5×2 cross-validation. Only models performing with a variance coefficient of determination r2>0.15 (gray dotted line) were retained. E. The ROC curves for different retinal biomarkers, including Cp, Aβ42, NLRP3, CCasp3, and retinal atrophy either individual or combined with retinal Aβ42. Each model was obtained by averaging the curves across diagnosis separately in each cross-validation fold. In the ROC curves plot, AUC is listed for each curve and unadjusted p values are included (***p < 0.001). F. The models were compared by using a Wilcoxon signed-rank test and p values were adjusted for multiple comparisons using Benjamini-Hochberg correction. The heat map shows that among the top 5 performing models, we have 3 that are different from one another. The model trained on retinal Cp + retinal Aβ42 performed best and was significantly different from the second-best model (retinal NLRP3 + retinal Aβ42) with p<0.05. The other three models were different from the top 2, but not from one another. Red arrows highlight retinal markers, individually or in combination, which were significantly different among the performance models to predict disease diagnosis. Statistics: *p < 0.05 and **p < 0.01, adjusted for multiple comparisons with Benjamini-Hochberg procedure.

References

    1. 2024 Alzheimer’s disease facts and figures. Alzheimers Dement. May 2024;20(5):3708–3821. doi: 10.1002/alz.13809 - DOI - PMC - PubMed
    1. The top 10 causes of death. World Health Organization. 2024;
    1. Ashraf GM, Tarasov VV, Makhmutovsmall a CA, et al. The Possibility of an Infectious Etiology of Alzheimer Disease. Mol Neurobiol. Jun 2019;56(6):4479–4491. doi: 10.1007/s12035-018-1388-y - DOI - PubMed
    1. Catumbela CSG, Giridharan VV, Barichello T, Morales R. Clinical evidence of human pathogens implicated in Alzheimer’s disease pathology and the therapeutic efficacy of antimicrobials: an overview. Transl Neurodegener. Jul 26 2023;12(1):37. doi: 10.1186/s40035-023-00369-7 - DOI - PMC - PubMed
    1. Jamieson GA, Maitland NJ, Wilcock GK, Craske J, Itzhaki RF. Latent herpes simplex virus type 1 in normal and Alzheimer’s disease brains. J Med Virol. Apr 1991;33(4):224–7. doi: 10.1002/jmv.1890330403 - DOI - PubMed

Publication types