[Preprint]. 2025 Jun 26:rs.3.rs-6623643.
doi: 10.21203/rs.3.rs-6623643/v1.

Higher-order Sonification of the Human Brain

Affiliations

Higher-order Sonification of the Human Brain

Francisco-Shu Kitaura et al. Res Sq. .

Abstract

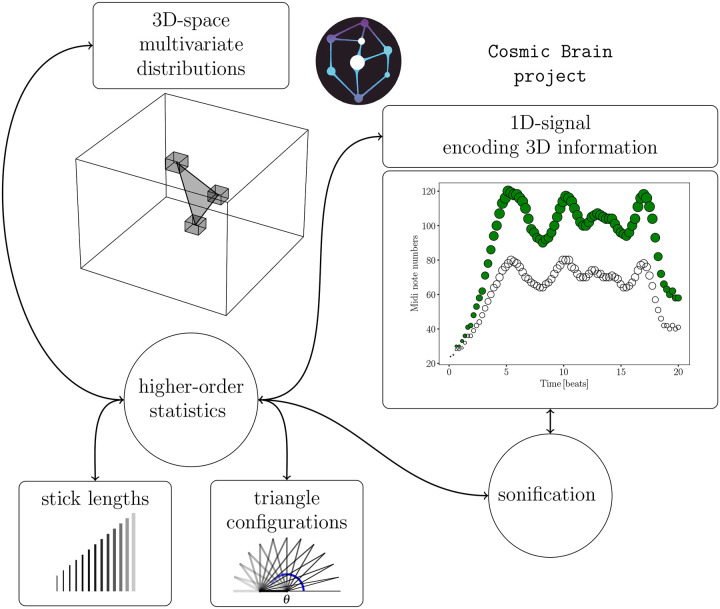
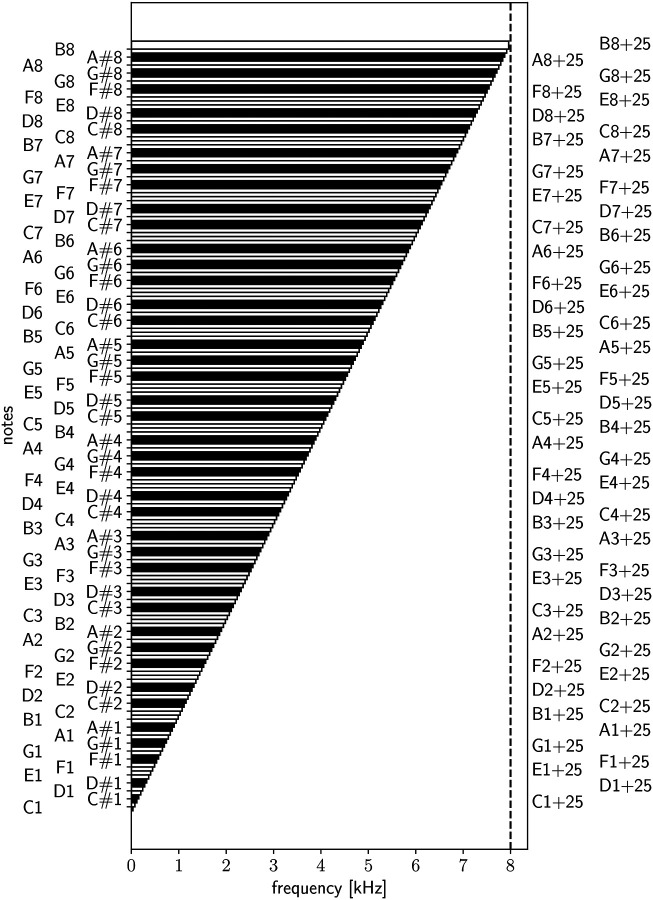
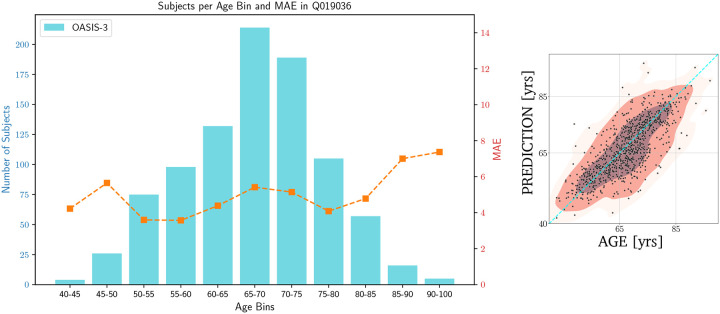
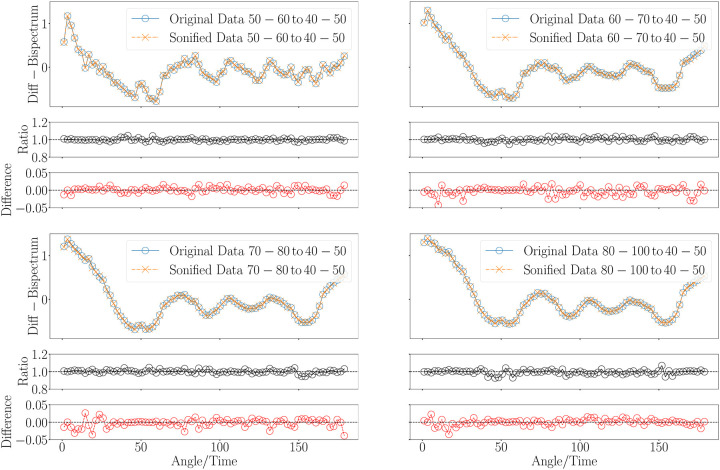
Sonification, the process of translating data into sound, has recently gained traction as a tool for both disseminating scientific findings and enabling visually impaired individuals to analyze data. Despite its potential, most current sonification methods remain limited to one-dimensional data, primarily due to the absence of practical, quantitative, and robust techniques for handling multi-dimensional datasets. We analyze structural magnetic resonance imaging (MRI) data of the human brain by integrating two- and three-point statistical measures in Fourier space: the power spectrum and bispectrum. These quantify the spatial correlations of 3D voxel intensity distributions, yielding reduced bispectra that capture higher-order interactions. To showcase the potential of the sonification approach, we focus on a reduced bispectrum configuration which applied to the OASIS-3 dataset (864 imaging sessions), yields a brain age regression model with a mean absolute error (MAE) of 4.7 years. Finally, we apply sonification to the ensemble-averaged (median) outputs of this configuration across five age groups: 40-50, 50-60, 60-70, 70-80, and 80-100 years. The auditory experience clearly reveals differentiations between these age groups, an observation further supported visually when inspecting the corresponding sheet music scores. Our results demonstrate that the information loss (e.g., normalized mean squared error) during the reconstruction of the original bispectra, specifically in configurations sensitive to brain aging, from the sonified signal is minimal. This approach allows us to encode multi-dimensional data into time-series-like arrays suitable for sonification, creating new opportunities for scientific exploration and enhancing accessibility for a broader audience.


Conflict of interest statement

The authors declare no competing interest. Additional Declarations: No competing interests reported.

Figures

Figure 1.
Figure 1.
This diagram illustrates the sonification method for three-dimensional data, utilizing higher-order statistical analysis in Fourier space. The two-point statistics are represented by sticks of varying lengths, which connect pairs of voxels (in the configuration space analog), indicating their respective intensities from the MRI scan. The three-point statistics are depicted through different triangle configurations, where two fixed side lengths are considered with varying subtended angles to connect three voxels. A one-dimensional function is derived by combining these statistical measures, which can then be directly sonified.
Figure 2.
Figure 2.
Sonification piano: notes used in this study covering the frequency range within the sensitivity of adult humans (20–30 yrs: ~16, 40 yrs: ~14, 50 yrs: ~12, 60 yrs: ~10, 70 yrs: ~8 kHz). Regular notes (Ci,Di,Ei,Fi,Gi,Ai,Bi for different octaves i ranging from 1 to 8) have been split into two columns (first two on the left) for visualisation purposes. The same has been done with quarter tones (indicated by +25) on the right. Semitones are indicated in the third column on the left. The piano convention of black keys for semitones is adopted. We consider sonification cases with and without quarter tones depending on the bispectrum configuration and the desired accuracy.
Figure 3.
Figure 3.
On the left: age distribution for the OASIS-3 864 MRI sessions dataset reduced by Carnero-Rosell et al. with the corresponding MAE at different AGE bins according to Random Forests classification based solely on the Q019036 bispectrum configuration. On the right: corresponding age regression.
Figure 4.
Figure 4.
Sonification of bispectra from human MRI, using an age group of 80–100 years as an example. The original data and the corresponding inverse mapping after sonification are displayed, with the bispectrum for the 40–50 age group included as a reference. The ratios and differences between the original and the inverse-mapped sonified signals are also presented.
Figure 5.
Figure 5.
Scores corresponding to (top:) the age group of 80 to 100 using as the reference the group of 40 to 50 to set the range; and (bottom:) the age group of 40 to 50.
Figure 6.
Figure 6.
Scores corresponding to the difference between the age group of 80 to 100 with the group of 40 to 50.
Figure 7.
Figure 7.
Sonification procedure across four panels: The upper-left panel shows the original signal with each data point represented by a small circle. In this example, the difference of the reduced bispectra (configuration k1=0.19 and k2=0.36) for age groups: 80–100 and 40–50 is shown. In the upper-right panel, the minimum value is subtracted from the signal. The lower-left panel illustrates the signal discretization process, additionally applying a linear mapping to convert the signal into the range of MIDI values that are perceptible to adult human listeners. Finally, the lower-right panel demonstrates the effect of incorporating a nonlinear rank-ordered transformation with a power-law of exponent fexp=0.45. The velocity (volume) of the sonified signal is represented through the size of the circles. The normalization is one.
Figure 8.
Figure 8.
Similar sonification procedure to Figure 7, but showing relative reduced bispectra relations (configuration k1=0.19 and k2=0.36). The different panels show the discretized signal for the 50–60 (upper-left), 60–70 (upper-right), 70–80 (lower-left), 80–100 (lower-right) age group within the range of the reference 40–50 years group mapped to the corresponding MIDI values. The filled circles stand for the reference bispectrum.
Figure 9.
Figure 9.
Sonification of reduced bispectra (configuration k1=0.19 and k2=0.36) from human brain magnetic resonance imaging for different ages. The original data and the corresponding inverse mapping after sonification are indicated for each age range.
Figure 10.
Figure 10.
Sonification of difference between reduced bispectra (configuration k1=0.19 and k2=0.36) from human brain magnetic resonance imaging for different ages groups with respect to the youngest age group in our sample (40–50 yrs). Upper-left panel: cnorm=0.25,fexp=0.7; upper-right panel: cnorm=0.5,fexp=0.35; lower-left panel: cnorm=0.75,fexp=0.35; lower-right panel: cnorm=1,fexp=0.45.

References

    1. Kramer G. Auditory display: Sonification, audification, and auditory interfaces (1994).
    1. Sawe Nik T. J., Chris Chafe. Using Data Sonification to Overcome Science Literacy, Numeracy, and Visualization Barriers in Science Communication. Front. Commun. 5, 46, DOI: 10.3389/fcomm.2020.00046 (2020). - DOI
    1. Arcand K. K. et al. A Universe of Sound: Processing NASA Data into Sonifications to Explore Participant Response. arXiv e-prints arXiv:2403.18082, DOI: 10.48550/arXiv.2403.18082 (2024). - DOI
    1. Ediyanto & Kawai N. Science Learning for Students with Visually Impaired: A Literature Review. In Journal of Physics Conference Series, vol. 1227 of Journal of Physics Conference Series, 012035, DOI: 10.1088/1742-6596/1227/1/012035 (IOP, 2019). - DOI
    1. Russo M., Gernon T. M., Santaguida A. & Hincks T. K. Improving Earth science communication and accessibility with data sonification. Nat. Rev. Earth Environ. 5, 1–3, DOI: 10.1038/s43017-023-00512-y (2024). - DOI

Publication types

LinkOut - more resources